Figures & data
Figure 1. Surface morphological observations and contact angle test of fabricated nanofilms with different constitute proportions. (A, representative images of SEM; B, representative images of TEM; C, representative images of LSCM, green color: FITC-BSA in TGF-β3 solutions in the core part of nanofibers; and D, water contact angle test). LSCM: laser scanning electron confocal microscope; SEM: scanning electron microscope; TEM: transmission electron microscope.
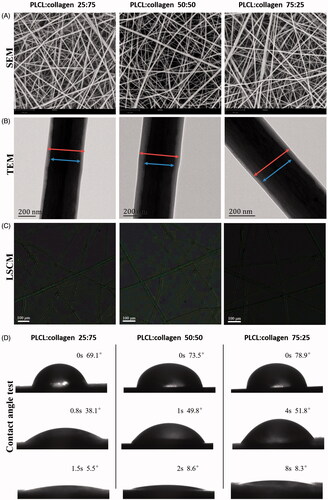
Figure 2. Mechanical properties, release behaviours and degradation characteristics of different nanofilms (A, typical stress–strain curves; B, TGF-β3 release profiles of different nanofilms; and C, representative images of SEM after degradation for 1 month, and 2 months in vitro).
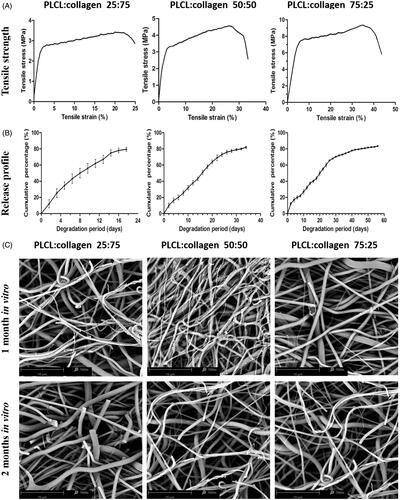
Figure 3. Isolation and identification of BMSCs, and cytocompatibility of different nanofilms (A, representative images of BMSCs under light microscope; B, flow cytometry of specific multipotential stem cells; C, MTT assay of different nanofilms; and D, representative images of SEM and fluorescent staining after BMSCs were seeded on different nanofilms.). * indicates statistical difference compared with culture plate. Red: cytoskeleton, Blue: nucleus.
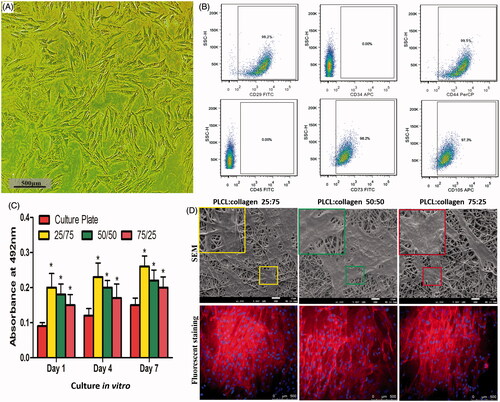
Figure 4. Chondrogenesis inducing potential evaluation (A, Sandwich model nanofilms stacking and subcutaneous implantation in nude mice; B, list of different groups, and GAG contents of different groups after subcutaneous implantation; and C, representative images of HE, Toluidine blue and Safranin O stainings, and IHC of type II collagen). Scale bars: 200 μm. * indicates statistical difference between groups.
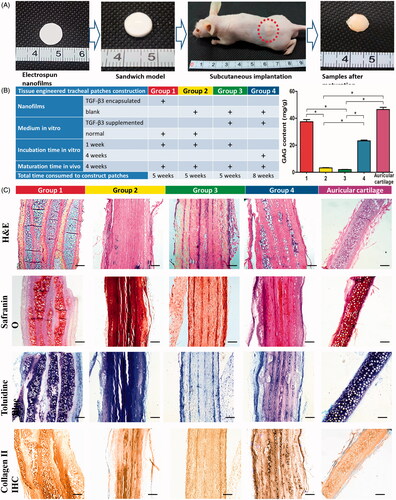
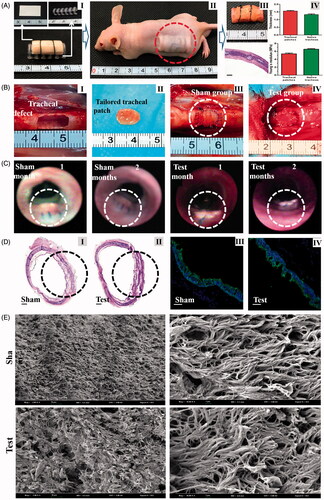
Figure 5. A, Construction of engineered tracheal patches (I, construction of engineered patches in vitro; II, subcutaneous implantation in nude mice; III, gross observation and HE staining (Scale bars: 500 μm) of tracheal patches after maturation in vivo; IV, thickness and Young's modulus of tracheal patches and native tracheas.). B, Tracheal reconstruction with tissue engineered patches (I, artificially caused tracheal defects in rabbit model; II, tailored engineered tracheal patches; III, tracheal antetheca was excised and then anastomosed with residual trachea in sham group; and IV, tailored patch was anastomosed with residual trachea in test group.). C, Bronchoscope examination 1 month and 2 months after operation. D, Histological examinations 2 months post operation (I and II, representative images of HE staining (Scale bars: 500 μm); III and IV, representative immunofluorescent images of tracheal epithelial cells (Green: cytokeratin 5/8, Blue: nucleus, Scale bars: 250 μm)). E, SEM observation of the luminal surface of the defects 2 months after operation.
Dotted circular rings indicate tracheal reconstruction operation areas.