Figures & data
Figure 1. Inhibition of TAK1 alleviates ischemia-induced renal fibrosis in vivo. (A) Effect of TAK1 inhibition on serum creatinine in vehicle group and TAK1 inhibitor group mice at 24 h after IR or sham treatment. ***p < .001 versus sham vehicle; +p < .05 versus TAK1 inhibitor IR; #p < .05 versus vehicle IR. n = 6 in each group. (B) Effect of TAK1 inhibition on serum urea nitrogen in Vehicle group and TAK1 inhibitor group mice at 24 h after IR or sham treatment. ***p < .001 versus sham vehicle; +p < .05 versus TAK1 inhibitor IR; #p < .05 versus vehicle IR. n = 6 in each group. (C) HE staining for kidney sections of vehicle group and TAK1 inhibitor group mice at 24 h after IR or sham treatment (original magnification: ×400, Scale bar: 50 μm). (D) Quantitative assessment of tubular damage in vehicle and TAK1 inhibitor group mice at 24 h after IR treatment. ***p < .001 versus vehicle IR. n = 6 in each group. (E) Representative photomicrographs of kidney sections stained with Sirius red for assessment of total collagen deposition in vehicle group and TAK1 inhibitor group mice at 14 days after IR or sham treatment. Scale bar: 50 μm. (F) Quantitative analysis of interstitial collagen content in kidneys of vehicle group and TAK1 inhibitor group mice at 14 days after IR or sham treatment. ***p < .001 versus sham vehicle; +p < .05 versus TAK1 inhibitor IR; #p < .05 versus vehicle IR. n = 6 in each group.
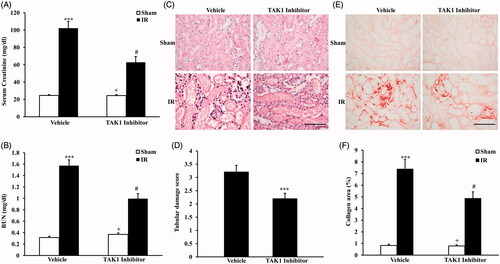
Figure 2. Inhibition of TAK1 decrease collagen I and fibronectin expression in kidney treated with IR. (A) Representative photomicrographs of collagen I immunofluorescence staining in kidneys of mice in vehicle group and TAK1 inhibitor group at 14 days after IR or sham treatment. (B) Quantitative analysis of collagen I positive area in kidneys of mice in vehicle group and TAK1 inhibitor group at 14 days after IR or sham treatment. ***p < .001 versus sham vehicle; +p < .05 versus TAK1 inhibitor IR; #p < .05 versus vehicle IR. n = 6 in each group. (C) Representative photomicrographs of fibronectin immunofluorescence staining in kidneys of mice in vehicle group and TAK1 inhibitor group at 14 days after IR or sham treatment. (D) Quantitative analysis of fibronectin positive area in kidneys of mice in Vehicle group and TAK1 inhibitor group at 14 days after IR or sham treatment. ***p < .001 versus sham vehicle; +p < .05 versus TAK1 inhibitor IR; #p < .05 versus Vehicle IR. n = 6 in each group. (E) Representative western blots showed protein levels of collagen I and fibronectin in kidneys of mice in vehicle group and TAK1 inhibitor group at 14 days after IR or sham treatment. (F) Quantitative analysis of collagen I protein expression of kidneys in vehicle group and TAK1 inhibitor group mice at 14 days after IR or sham treatment. ***p < .001 versus sham vehicle; +p < .05 versus TAK1 inhibitor IR; #p < .05 versus vehicle IR. n = 6 in each group. (G) Quantitative analysis of fibronectin protein expression of kidneys in vehicle group and TAK1 inhibitor group mice at 14 days after IR or sham treatment. ***p < .001 versus sham vehicle; +p < 0.05 versus TAK1 inhibitor IR; #p < .05 versus vehicle IR. n = 6 in each group.
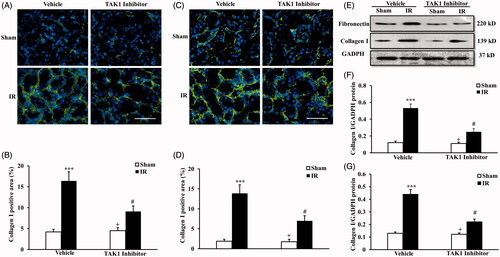
Figure 3. Inhibition of TAK1 decrease apoptotic cell death and p38 phosphorylation in kidney treated with IR. (A) Representative photomicrographs of kidney sections stained for apoptotic cells and counterstained with methyl green in kidneys. Scale bar: 50 μm. (B) Quantitative analysis of TUNEL-positive cells in the kidneys. ***p < .001 versus sham vehicle; +p < .05 versus TAK1 inhibitor IR; #p < .05 versus Vehicle IR. n = 6 in each group. HPF, high power field; TUNEL, terminal transferase dUTP nick-end labeling. (C) Representative western blots show Bax and cleaved caspase 3 protein levels in the kidneys after sham or IR. (D) Quantitative analysis of Bax protein levels in the kidneys. ***p < .001 versus sham vehicle; +p < .05 versus TAK1 inhibitor IR; #p < .05 versus vehicle IR. n = 6 in each group. (E) Quantitative analysis of cleaved caspase 3 protein levels in the kidneys. ***p < .001 versus sham vehicle; +p < .05 versus TAK1 inhibitor IR; #p < .05 versus Vehicle IR. n = 6 in each group. (F) Representative western blots showed phosphorylation levels of p38 in the kidneys after sham or IR. (G) Quantitative analysis of p38 phosphorylation in the kidneys after sham or IR. ***p < .001 versus sham vehicle; +p < .05 versus TAK1 inhibitor IR; #p < .05 versus vehicle IR. n = 6 in each group.
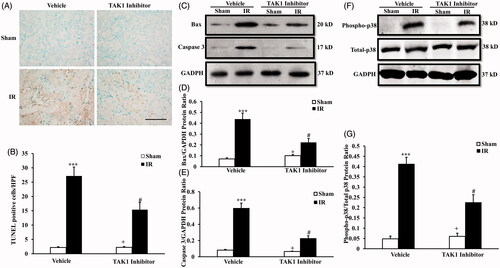
Figure 4. TAK1 expression pattern and the correlation between TAK1 or TUNEL and p38. (A) Representative photomicrographs of TAK1 immunohistochemical staining in kidneys of mice with IR model or Sham (original magnification: ×400, Scale bar: 50 μm). (B) Quantitative analysis of TAK1 positive cells in kidneys of mice with IR model or Sham. ***p < .001 versus sham, n = 6 each. (C) Representative photomicrographs of renal tubular epithelial cells with H/R or sham treatment stained for TAK1, p38 and DAPI. Scale bar: 10 μm. (D) Quantitative analysis of TAK1+ and p38+ renal tubular epithelial cells with H/R or sham treatment. *p < 0.05 versus sham, n = 4 per group. (E) Representative photomicrographs of renal tubular epithelial cells with H/R or sham treatment stained for p38, TUNEL and DAPI. Scale bar: 10 μm. (F) Quantitative analysis of p38+ and TUNEL+ renal tubular epithelial cells with H/R or sham treatment. *p < .05 versus sham, n = 4 per group.
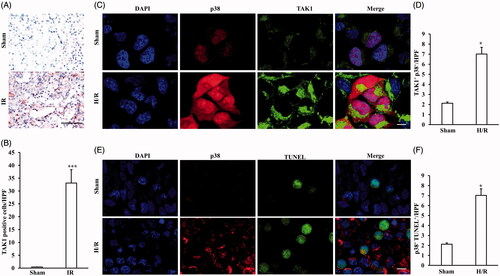
Figure 5. Upregulation of TAK1 aggravates apoptosis of renal tubular epithelial cells with H/R treatment. (A) TUNEL assay of apoptosis with mouse renal tubular epithelial cells. (B) Quantitative analysis of apoptosis ratio from vehicle and TAK1 overexpression plasmid transfected mouse renal tubular epithelial cells with sham or H/R treatment. *p < .05 versus vehicle sham; +p < .05 versus TAK1 overexpression H/R; #p < .05 versus vehicle H/R, n = 4 each. (C) Flow cytometry of apoptosis rate with mouse renal tubular epithelial cells. (D) The percentage of apoptotic cells from vehicle and TAK1 overexpression plasmid transfected mouse renal tubular epithelial cells with sham or H/R treatment. *p < .05 versus vehicle sham; +p < .05 versus TAK1 overexpression H/R; #p < .05 versus vehicle H/R, n = 4 each. (E) Representative western blots show Bax and cleaved caspase 3 protein levels in the renal tubular epithelial cells of mice with H/R or sham treatment after TAK1 overexpression plasmid or vehicle transfection. (F) Quantitative analysis of Bax protein levels in the renal tubular epithelial cells. *p < .05 versus vehicle sham; +p < .05 versus TAK1 overexpression H/R; #p < .05 versus vehicle H/R, n = 4 each. (G) Quantitative analysis of cleaved caspase 3 protein levels in the renal tubular epithelial cells. *p < .05 versus vehicle sham; +p < .05 versus TAK1 overexpression H/R; #p < .05 versus vehicle H/R, n = 4 each.
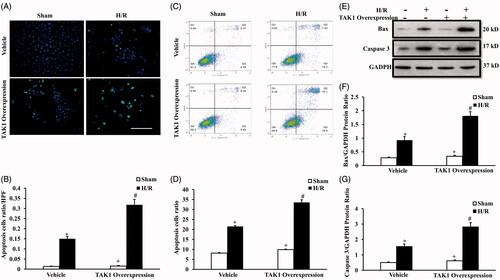
Figure 6. Upregulation of TAK1 aggravates collagen I and fibronectin expression and p38 phosphorylation of renal tubular epithelial cells with H/R treatment. (A) Representative western blots show collagen I and fibronectin protein levels in the renal tubular epithelial cells of mice with H/R or sham treatment after TAK1 overexpression plasmid or vehicle transfection. (B) Quantitative analysis of collagen I protein levels in the renal tubular epithelial cells. *p < .05 versus vehicle sham; +p < .05 versus TAK1 overexpression H/R; #p < 05 versus vehicle H/R, n = 4 each. (C) Quantitative analysis of fibronectin protein levels in the renal tubular epithelial cells. *p < .05 versus vehicle sham; +p < .05 versus TAK1 overexpression H/R; #p < .05 versus vehicle H/R, n = 4 each. (D) Representative western blots show phosphorylation levels of p38 in the renal tubular epithelial cells of mice with H/R or sham treatment after TAK1 overexpression plasmid or vehicle transfection. (E) Quantitative analysis of phosphorylation levels of p38 in the renal tubular epithelial cells. *p < .05 versus vehicle sham; +p < .05 vs. TAK1 overexpression H/R; #p < .05 versus vehicle H/R, n = 4 each.
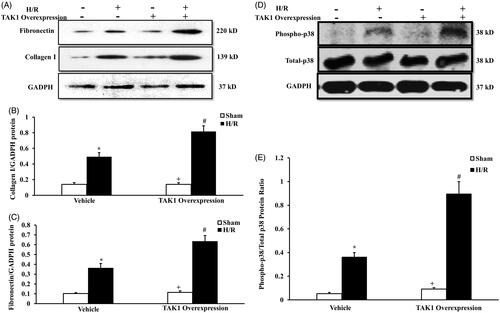
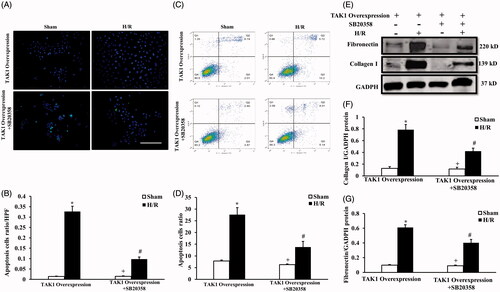
Figure 7. TAK1-mediated apoptosis and induced fibrosis via p38 activation in renal tubular epithelial cells treated with H/R. (A) TUNEL assay of apoptosis with mouse renal tubular epithelial cells. (B) Quantitative analysis of apoptosis ratio from TAK1 overexpression plasmid transfected mouse renal tubular epithelial cells plus vehicle or SB20358 with sham or H/R treatment. *p < .05 versus TAK1 overexpression sham; +p < .05 versus TAK1 overexpression + SB20358 H/R; #p < .05 versus TAK1 overexpression H/R, n = 4 each. (C) Flow cytometry of apoptosis rate with mouse renal tubular epithelial cells. (D) The percentage of apoptotic cells from TAK1 overexpression plasmid transfected mouse renal tubular epithelial cells plus vehicle or SB20358 with sham or H/R treatment. *p < .05 versus TAK1 overexpression sham; +p < .05 versus TAK1 overexpression + SB20358 H/R; #p < .05 versus TAK1 overexpression H/R, n = 4 each. (E) Representative western blots show collagen I and fibronectin protein levels in the renal tubular epithelial cells of mice with H/R or sham treatment after TAK1 overexpression plasmid transfection plus SB20358 or vehicle. (F) Quantitative analysis of collagen I protein levels in the renal tubular epithelial cells. *p < .05 versus TAK1 overexpression sham; +p < .05 versus TAK1 overexpression + SB20358 H/R; #p < .05 versus TAK1 overexpression H/R, n = 4 each. (G) Quantitative analysis of fibronectin protein levels in the renal tubular epithelial cells. *p < .05 versus TAK1 overexpression sham; +p < .05 versus TAK1 overexpression + SB20358 H/R; #p < .05 versus TAK1 overexpression H/R, n = 4 each.