
Figures & data
Table 1. Composition and physicochemical properties of natamycin bilosomes (mean ± SD; n = 3).
Table 2. Composition and characterization of NB in situ hydrogel formulations (mean ± SD; n = 3).
Figure 1. Transmission electron micrograph (TEM) depicting the layered morphology of NT bilosomes.
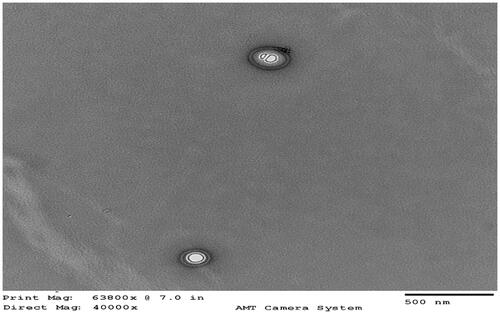
Figure 2. FTIR spectra of (A) sodium taurocholate, (B) cholesterol, (C) span 60, (D) natamycin and (E) NBG 2 formulation.
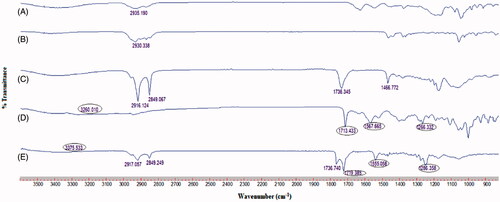
Figure 3. Cytotoxicity profile of NB 2 and NBG 2 formulations in HCLE cells (mean ± SEM; n = 6).
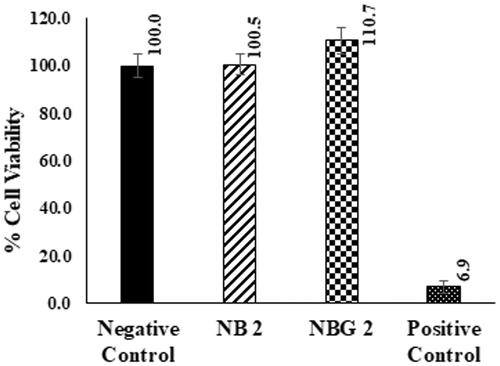
Table 3. In vitro transcorneal permeability parameters of natamycin from bilosomes and bilosomes in situ gel formulations (mean ± SD; n = 3).
Table 4. The amount of natamycin in the ocular tissues of rabbits at the end of 2 h and 6 h post-topical administration with control, NB 2 and NBG 2 formulations (mean ± SEM; n = 4).
Figure 4. Histology images of rabbit corneas exposed to (A) DPBS, (B) control, (C) natamycin bilosomes (NB 2) and (D) natamycin bilosomes in situ gel (NBG 2) formulations. 1 and 2 indicates the 10 × and 100 × magnifications respectively. EP: epithelial layer; BM: Bowman's membrane; SL: stromal layer; DM: Descemet's membrane.
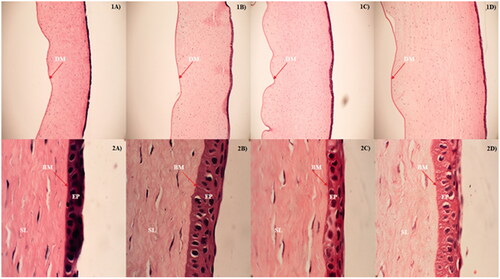
Figure 5. Mean dose normalized natamycin levels in rabbit ocular tissues from control, optimized natamycin bilosomes (NB 2) and bilosomes in situ gel (NBG 2) formulations, at (A) 2 h and (B) 6 h time point (mean ± SEM; n = 4). *– significantly different at p < .05. ND-not detected; Cr-Cornea; AH-Aqueous Humor; IC-Iris Ciliary Body; SC-Sclera; RC-Retina Choroid; VH-Vitreous Humor.
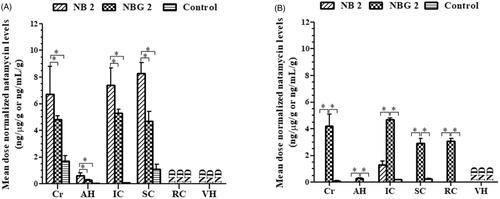
Table 5. Physical stability of optimized natamycin bilosomes and bilosome in situ gel formulations stored at 4 °C and 25 °C for 60 days (mean ± SD; n = 3).