Figures & data

Table 1. Physical characteristics of microsphere formulations with different inner phases.
Figure 1. The schematic diagram of LP-MSs.
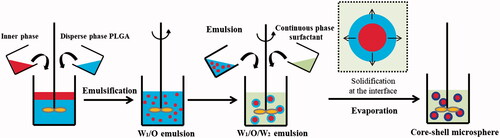
Figure 2. Micrographs of different inner phase of liquid (1), Gel 1 (2), Gel 2 (3) and solid (4).
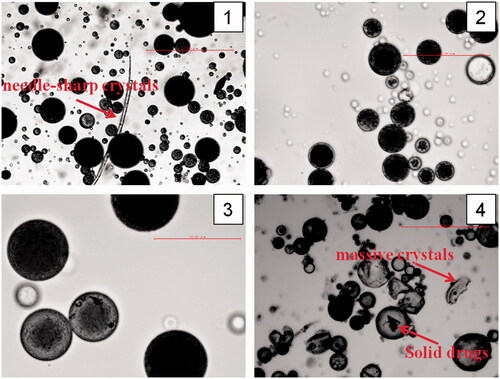
Figure 3. DSC thermograms (a) and XRPD patterns (b) of blank microspheres. LP: physical mixture and LP-MSs.
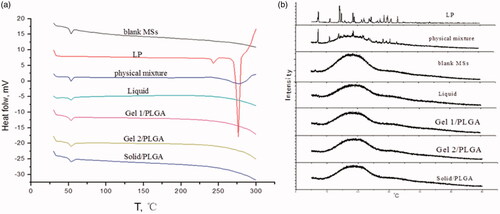
Figure 4. Degradation of different LP-loaded microspheres after exposure to PBS (pH 6.8) at 37 °C (n = 3) (***labels significant differences).
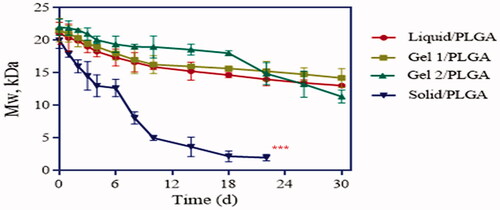
Figure 5. SEM images of different inner phase of liquid (1), Gel 1 (2), Gel 2 (3) and solid (4) before and after exposure to PBS (pH 6.8).
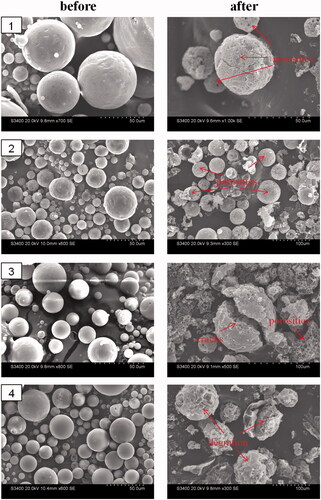
Figure 6. In vitro drug release profiles of LP-MSs with different inner phases, at 37 °C in PBS (pH 6.8) (n = 3).
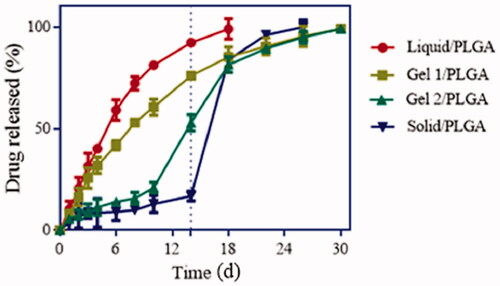
Figure 7. Plasma LP concentrations in rats received controlled group and experiment group of preparations with different inner phases, respectively (n = 5).
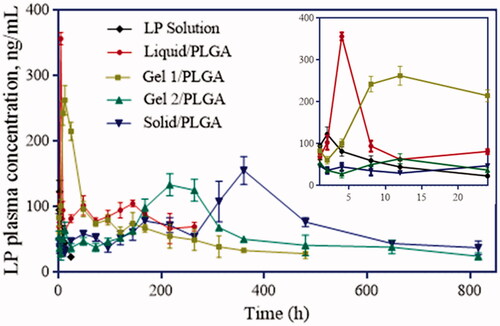
Table 2. Pharmacokinetic evaluation parameters of drug in SD rats after oral and intramuscular administrations of LP solution and LP-loaded MSs.
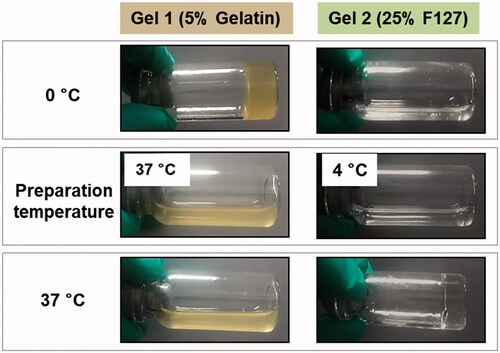
Figure 8. Liquid and gel states of Gel1 and Gel 2 at different temperatures, including the process of preparation and in vivo administration.