Figures & data
Figure 1. Schematic graph of MNP preparation and MNP delivery in stroma-rich PDA with and without CMNP treatment. NP were loaded with cyclopamine or paclitaxel and coated with red blood cell membrane. Without CMNP treatment, the tumour vessels are compressed by surrounding ECM components, leading to poor blood perfusion and limited MNP delivery. In contrast, after CMNP treatment, ECM components such as fibronectin were disrupted and tumour vessels were decompressed, resulting in enhanced blood perfusion and more effective delivery of PMNP. Thus, chemotherapy effect could be improved and the tumour growth was inhibited.
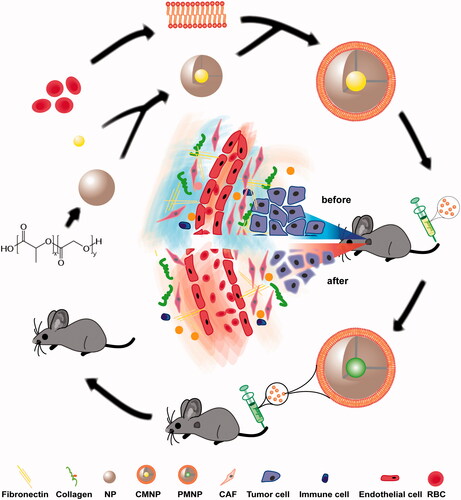
Figure 2. Characterizations of MNP (n = 4). (A) TEM image of MNP following 1% uranyl acetate staining. (B) Zeta potential and size of NP, RBC vesicle (MV), MNP, CMNP and PMNP. (C) Size monitoring of NP, CMNP and PMNP in 1 × PBS at 4 °C for 6 days. (D) Zeta potential monitoring of CMNP and PMNP at 4 °C for 6 days. (E) Drug release curves of cyclopamine from CMNP and free cyclopamine at 37 °C for 4 days. (F) Drug release curves of paclitaxel from PMNP and free PTX at 37 °C for 4 days.
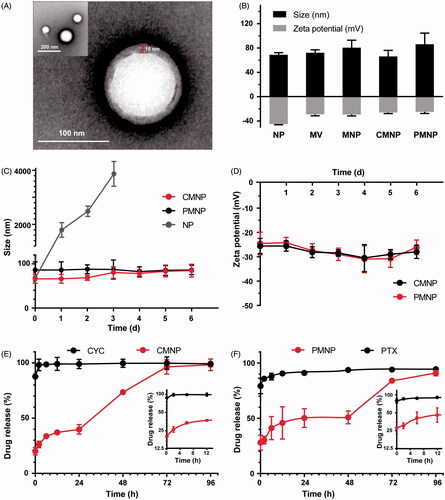
Figure 3. Cell uptake of MNP and cell viability after CMNP or PMNP treatment (n = 4). (A) Fluorescence images of MNP-treated Canpan-2 cells with or without CMNP pretreatment for 6 h. (B) Cell viabilities of Capan-2 cells after incubation with various concentrations of CMNP (cyclopamine concentration varied from 0, 1, 5, and 20 µM) at 37 °C for 24 h. (C) Cell viabilities of Capan-2 cells after incubation with various concentrations of PMNP (PTX concentration varied from 0, 0.25, 1, 10 and 20 µg/mL) 37 °C for 24 h. *p < .05, ***p < .001, compared with the control group (PTX concentration equals to 0 µg/mL). (D) Cell viabilities of HUVEC cells after incubation with various concentrations of CMNP (cyclopamine concentration varied from 0, 1, 5, and 20 µM) at 37 °C for 24 h. (E) Cell viabilities of HUVEC cells after incubation with various concentrations of PMNP (PTX concentration varied from 0, 0.25, 1, 10 and 20 µg/mL) 37 °C for 24 h.
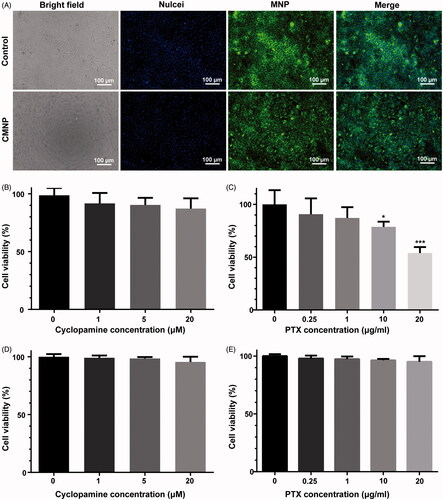
Figure 4. ECM disruptions by CMNP treatment evaluated by (A) H & E staining and (B) immunofluorescence staining (n = 6). After treatment with PBS, CYC or CMNP for 18 days, Capan-2 tumour xenografts were obtained for H&E staining and immunofluorescence staining.
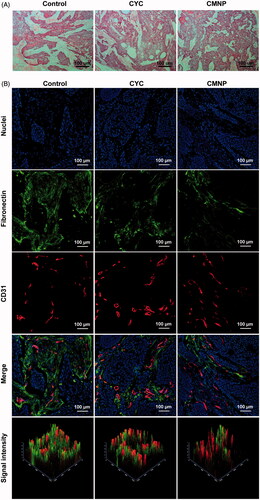
Figure 5. Tumour perfusion improved by CMNP treatment (n = 6). (A) In vivo photoacoustic imaging of Capan-2 tumour xenografts after treatment with PBS, CYC or CMNP for 18 days and (B) the corresponding average oxygen saturation and (C) total haemoglobin level in tumour regions. (D) The fluorescence imaging of tumour slices after lectin 488 labelling and (E) the percentage of functional vessels (lectin 488 positive) in tumour vessels after CMNP treatment. **p < .01 compared with the control group, #p < .05 compared with the CYC group.
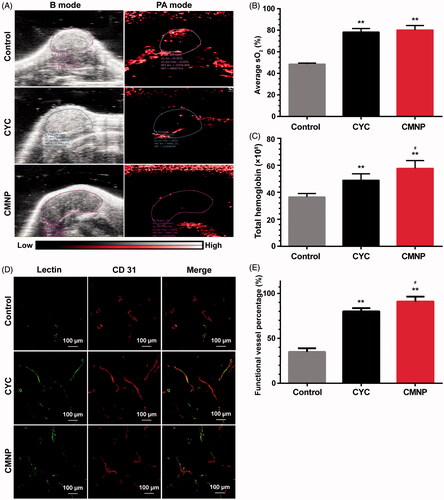
Figure 6. Pharmacokinetics of MNP and enhanced tumour delivery of MNP by CMNP treatment (n = 6). (A) Pharmacokinetics curves of NP, MNP and PEG-NP. (B) t1/2 of NP, MNP and PEG-NP in blood. **p < .01, compared with the NP group. ##p < .01, compared with the PEG-NP group. (C) In vivo fluorescence imaging of mouse models pretreated with CMNP at 24 h after MNP injection and (D) the corresponding fluorescence intensity of tumours determined by In vivo IVIS spectrum imaging system. The circle indicated the tumour. *p < .05, compared with the control group. (E) Ex vivo fluorescence imaging of major organs and tumours harvested at 24 h after MNP injection. (F) Biodistribution of MNP in major organs and tumours at 24 h after MNP injection. ***p < .001 compared the CYC group or the CMNP group.
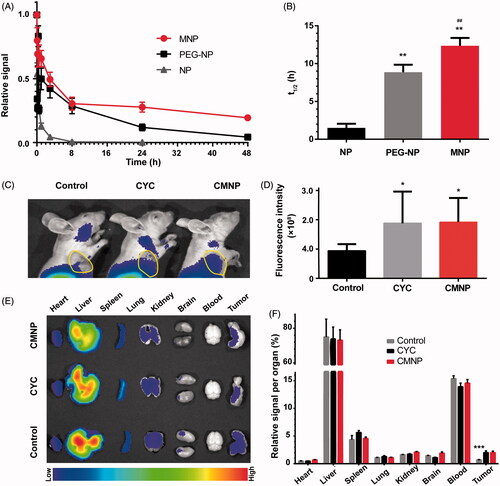
Table 1. Pharmacokinetics parameters of PEG-NP and MNP.
Figure 7. Antitumour efficacy of PMNP combined with CMNP (n = 5). (A) Survival curve of mouse models after different treatments recorded from 14th day to 28th day. (B) Bight images of tumour xenografts obtained at the study end point. (C) Tumour volume and (D) tumour weight of tumour xenografts at the study end point. *p < .05, **p < .01, ***p < .001, compared the Blank group. #p < .05, ##p < .01, compared with the CMNP + PMNP group. (E) Tumour cell apoptosis assay by dUTP-mediated nick-end-labelling (TUNEL).
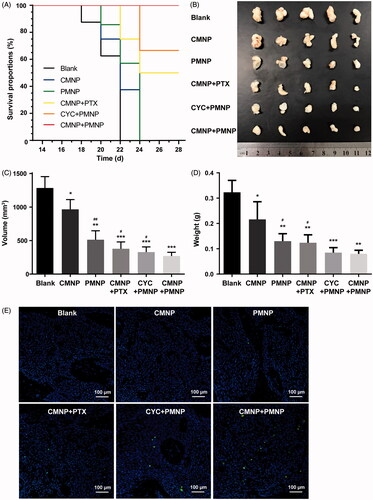
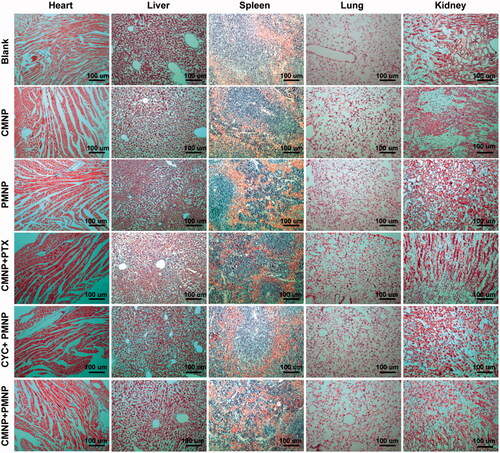
Figure 8. H&E staining of slices of major organs including hearts, livers, spleens, lungs and kidneys from mouse models in different treatment groups (n = 5).