Figures & data
Figure 1. Characterizations of ZnO nanoparticles. (A) Morphology of ZnO nanoparticles; (B) Size distribution and (C) zeta potential of ZnO nanoparticles dissolved in DMEM.
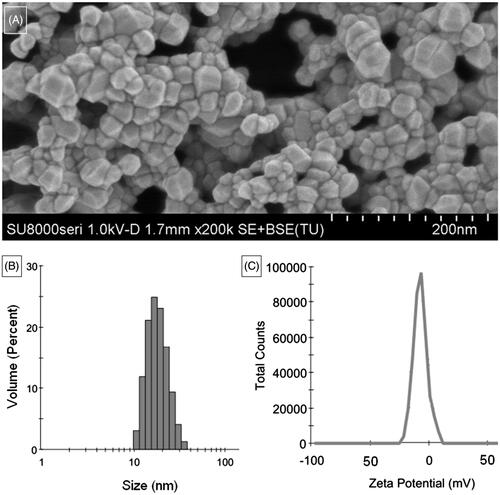
Figure 2. Changes of cell morphology after exposure to different concentrations of ZnO nanoparticles for 6 h. (A) Control cells; (B) cells treated with 31.25; (C) 62.5 and (D) 125.0 μmol/l ZnO nanoparticles, respectively. Bar =20 μm.
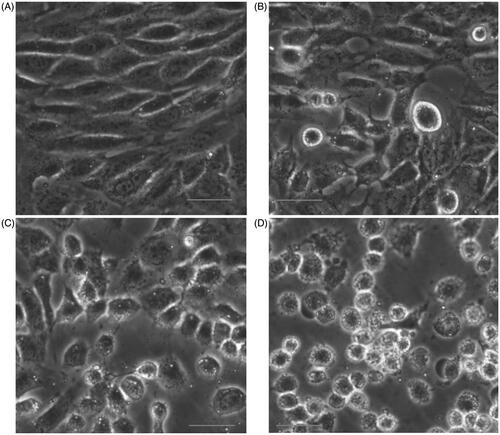
Figure 3. Effects of different concentrations of ZnO nanoparticles on 661 W cells for 6 h. (A) Alterations of cytochrome c levels in cell culture supernatants; (B) Cellular ATP content; (C) Collapse of mitochondrial membrane potential; (D) Analysis of intracellular ROS levels; (E) Alterations of intracellular total antioxidant enzyme activities and (F) Apoptosis/necrosis analysis. Results are shown as mean ± SD of three independent experiments. *p < .05 and **p < .01 versus relevant control.
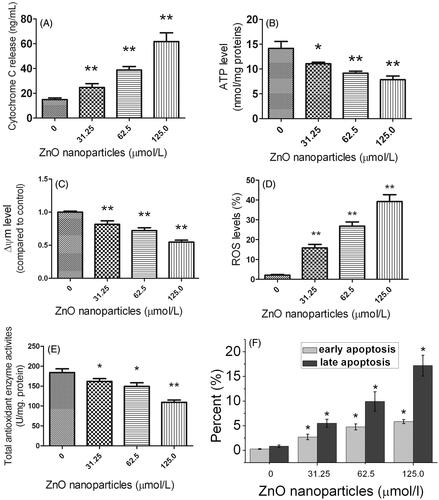
Table 1. Summary of label-free quantitative proteomic profiling results.
Figure 4. Summary of mitochondria-related proteins identified by LC-MS/MS.
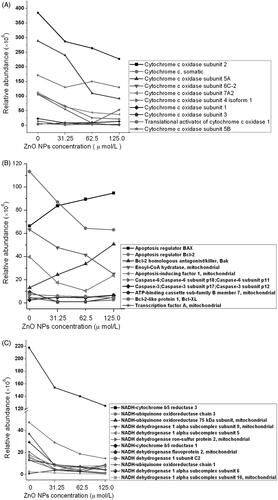
Figure 5. Determinations of Bax, Bcl-2 and Caspase 3 expressions at mRNA and protein levels after exposure to different concentrations of ZnO nanoparticles for 6 h. (A), (B) and (C) were determined using quantitative PCR, (D), (E) and (F) were determined by ELISA. *p < .05 and **p < .01 versus relevant controls.
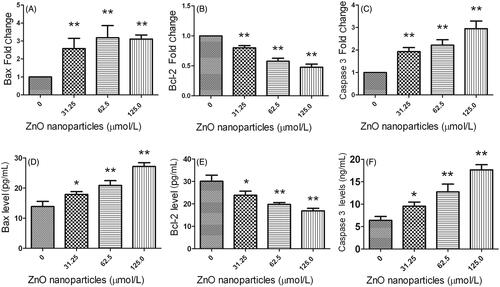
Figure 6. Gene ontology (GO) analysis of differentially expressed proteins. Categorization of differentially expressed proteins was analyzed according to molecular function and biological progress.
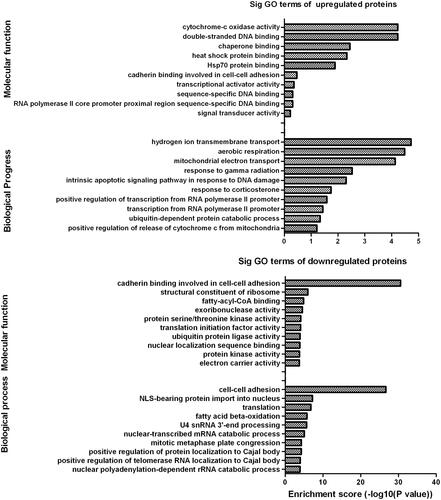
Figure 7. KEGG pathway analyses. The analysis indicates the categorization of significant pathways based on differentially expressed proteins after cells exposure to different concentrations of ZnO nanoparticles.
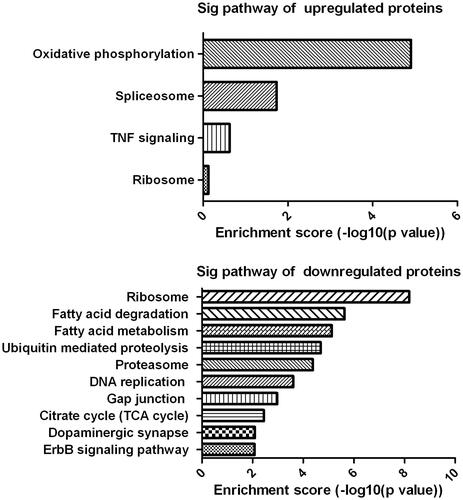
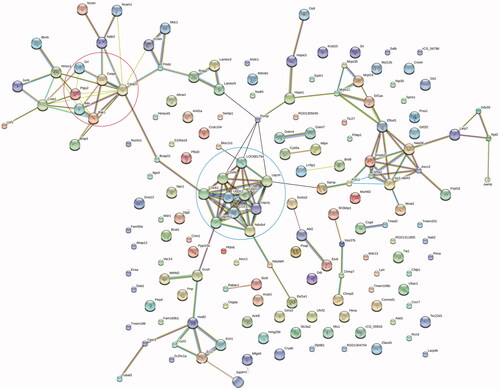
Figure 8. Protein-protein interaction analyses of differentially expressed proteins. Result indicates the cluster of mitochondria-related apoptotic proteins (top left circle) is linked to that of cytochrome c-related proteins (bottom right circle) via Bcap31.