Figures & data
Figure 1. Overview of the direct conversion of a single fibroblast into astrocytes by quantitative injection system. (A) A scheme for astrocyte induction from a single fibroblast by quantitatively controlled injection of plasmid DNAs. (B) Representative fibroblast expressing a marker CD90 and astrocytes expressing a marker GFAP. Astrocytes converted from fibroblast cell which induced by single cell injection. Fibroblast marker CD90 and Astrocyte marker GFAP was labeled by immunofluorescence method. Scale bar = 100 μm.
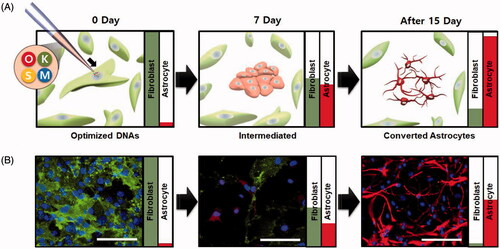
Figure 2. Expression patterns of each reprogramming factor in a single cell. (A) Expression levels of the exogenous reprogramming factors in the injected fibroblasts. Oct4, klf4, Sox2 and cMyc genes were injected into a single cell. The expression of each gene was observed by immunofluorescence microscopy (green fluorescence). Cells were observed with optical fluorescence microscope. (B) Gene expression of reprogramming factors in the injected fibroblasts. Different amount of the exogenous reprogramming factors Oct4, klf4, Sox2 and cMyc were injected into a single fibroblast. The expression levels of each gene were analyzed by real-time RT-PCR. (C) Sustainability and intensity of the expression levels in the injected cells in time-dependent manner. Contour gradient indicates increase in gene expression from blue to yellow.
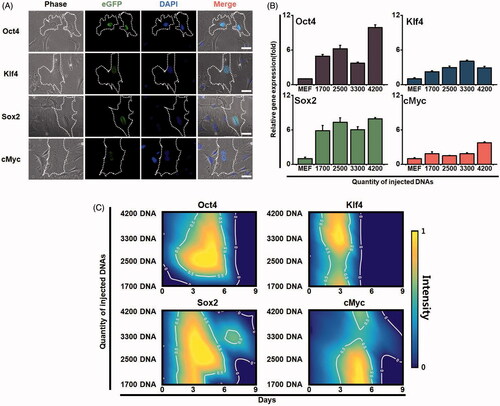
Figure 3. Changes of cell morphology and gene expression of the injected cells during a direct conversion process. (A) Morphological changes of plasmid DNA-injected cells. We injected 1700 DNA and 2500 DNA molecules into different single cells, and morphology was observed at seven and 13 days after injection, respectively. Cells were observed with a phase contrast microscope. The scale bar size is 50 μm. (B) The relative RNA expression levels of astrocyte marker genes GFAP and S100b in converted cells. Gene expression was analyzed by real-time RT-PCR. Total RNAs were collected from the cells injected with 1700, 2500, 3300 and 4200 DNA molecules. Statistically significant differences were calculated using independent and paired Student’s t-tests for unpaired and paired samples. p < .05 was considered statistically significant. (C) The relative RNA expression levels of the exogenously injected genes, GFAP regulator genes, and the demethylation-related TET family genes TET1, TET2 and TET3 under the condition wherein 2500 DNA molecules were injected. Each gene expression level was analyzed by real-time RT-PCR. Total RNAs were collected at days 5, 7 and 10. (D) Sox2 directly binds to BMP2 gene from MEF cells. One Sox2 binding site was identified in mouse BMP2 gene. Bar indicates the motif that is conserved between mouse and human genes. ChIP analysis shows that Sox2 bound to the site. Input DNA was used for positive control.
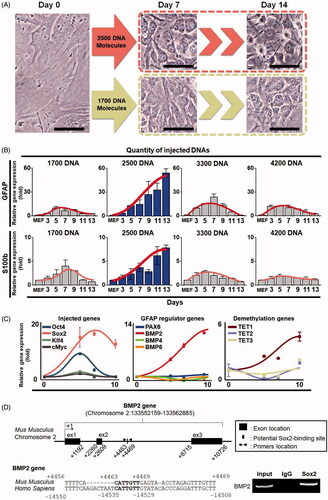
Figure 4. Expression levels of fibroblast and astrocyte markers in a time-dependent manner during the direct conversion process. Cells that were injected with 2500 DNA molecules were converted into astrocytes in a culture condition for neural cells. (A) Expression levels of the marker proteins, the fibroblast marker CD90 and astrocyte marker GFAP were analyzed by immunofluorescence assays. (B) Rate of cells expressing markers. Cells expressing the fibroblast marker CD90 and astrocyte marker GFAP were counted.
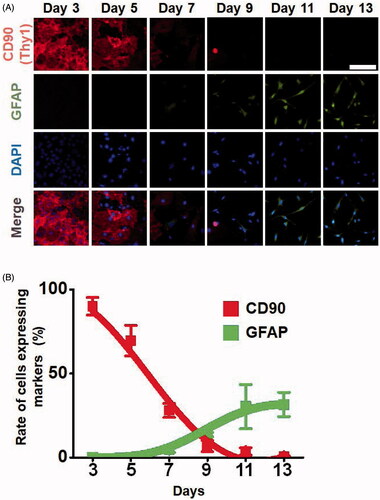
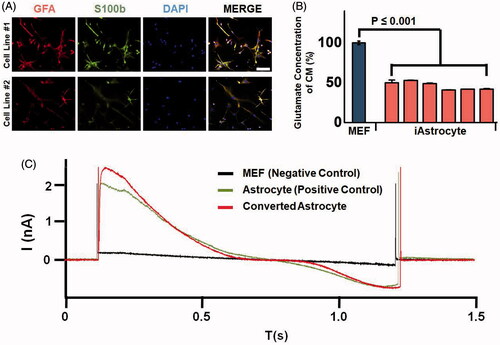
Figure 5. Functionality of the astrocytes converted from a single fibroblast by quantitative injection. (A) Astrocytes expressing marker proteins GFAP and S100b by immunofluorescence assays. (B) Glutamate uptake ability assay of the converted astrocytes. Glutamate concentration was analyzed in the conditioned medium of fibroblast (black bar) and in converted astrocytes (white bar). p < .01 was considered statistically significant. (C) Electrophysiology results of mouse embryonic fibroblasts as a negative control, astrocytes as a positive control, and converted astrocytes.