
Figures & data
Figure 1. Colour change of the reaction solution from (a) Light yellow to (b) Dark brown indicates the formation of IH-AgNPs.
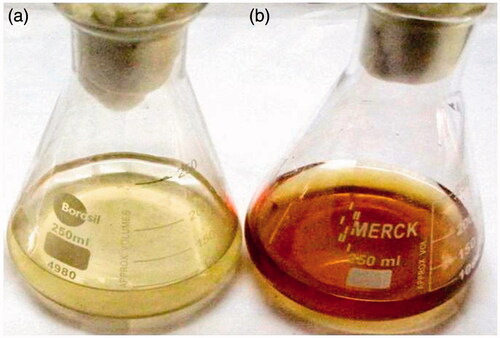
Figure 2. UV-Vis spectrum of colloidal solution of IH-AgNPs shows characteristic SPR peak at 436 nm.
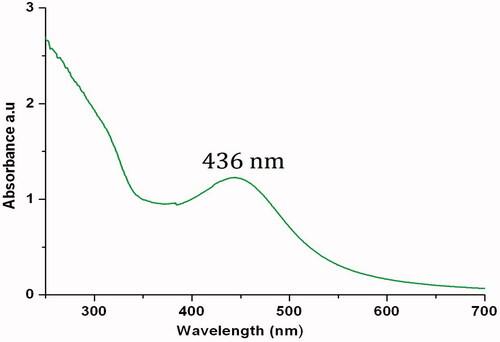
Figure 3. (a) TEM micrograph of IH-AgNPs at 10 nm; magnification X1,00,000; (b) SAED pattern of IH-AgNPs shows diffraction rings, and (c) DLS analysis showed particle size distribution, average particle size and poly dispersity index.
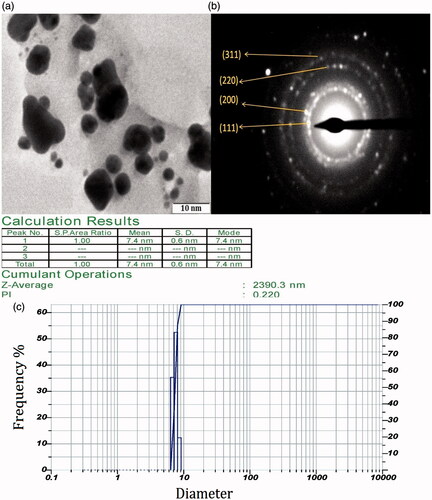
Figure 4. XRD pattern of biosynthesized IH-AgNPs.
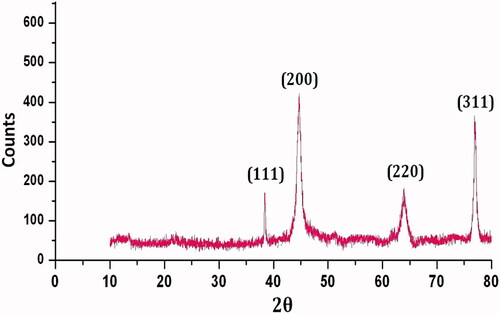
Figure 5. Zeta potential measurement of biosynthesized IH-AgNPs.
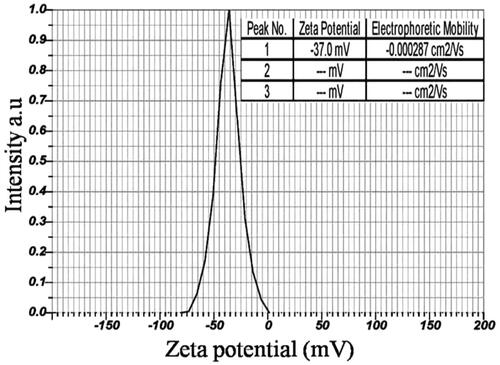
Figure 6. FTIR spectrum of biosynthesized IH-AgNPs.
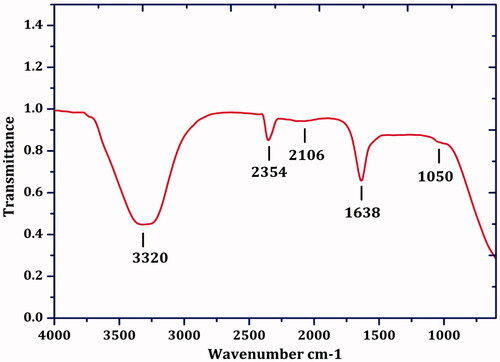
Figure 7. Antimicrobial activity of the IH-AgNPs against bacterial species (a) S. aureus, (b) B. subtilis, (c) P. aeruginosa (d) E. coli and fungal species (e) C. albicans, (f) C. nonalbicans and (g) C. tropicalis; (i) Inhibition zones observed by aqueous leaf extract of I. hirsuta, (ii) Inhibition zones observed by biosynthesized IH-AgNPs and (iii) Inhibition zones by standard drug.
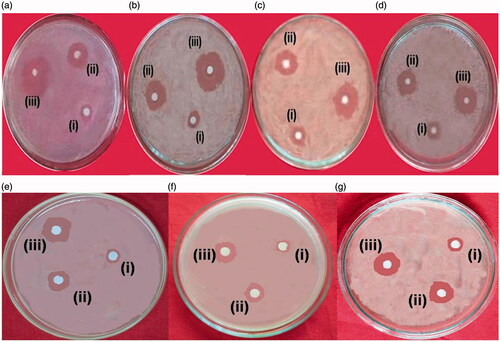
Figure 8. Comparison of (a) antibacterial and (b) antifungal activities of pristine aqueous leaf extract of I. hisuta, IH-AgNPs and standard drug (streptomycin/voriconazole).
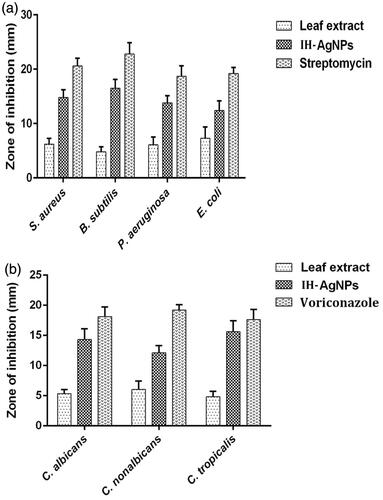
Figure 9. Free radical scavenging activity of IH-AgNPs. (a) DPPH radical scavenging activity and (b) H2O2 radical scavenging activity.
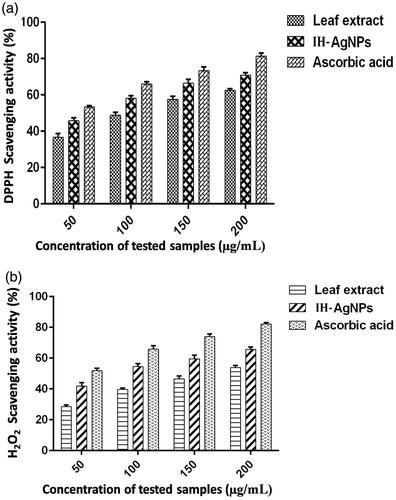
Figure 10. Effect of the IH-AgNPs on the cell viability of different cancer cells including B16F10, COLO205 and PC3.
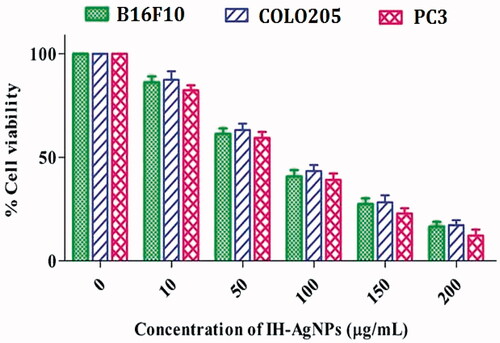
Figure 11. Effect of the IH-AgNPs on the cell viability of PC3 cells (a) Normal control (Without any treatment), (b) PC3 cells treated with 10 µg/mL of IH-AgNPs, (c) PC3 cells treated with 50 µg/mL of IH-AgNPs, (d) PC3 cells treated with 100 µg/mL of IH-AgNPs, (e) PC3 cells treated with 150 µg/mL of IH-AgNPs and (f) PC3 cells treated with 200 µg/mL of IH-AgNPs. Yellow box indicates cells undergo morphological changes, Green round circle indicates the initial apoptotic cells, Red round circles indicates dead cells or nonviable cells. Increase in the concentration of IH-AgNPs increases the cytotoxic activity (or increase in the number of non-viable cells).
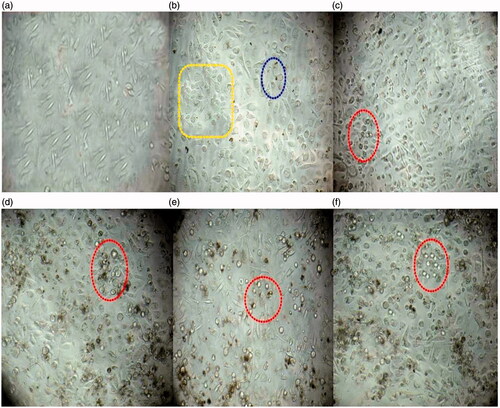
Table 1. Represents the characteristic features and biological activities of biosynthesized IH-AgNPs using leaf extract of I. hirsuta.