Figures & data
Scheme 1. Culture of tumor cells on the tumor microenvironment-mimetic platforms. (A) The conventional 2 D monolayer cell culture method. (B) A 3 D spheroid cell culture method that can mimic the tight cell-cell interaction and high cell density of native tumors. (C) A method for culturing cells in the microfluidic channels capable of simulating a fluidic microenvironment in which an interstitial flow is present. (D) The culture of cancer cells in an ECM-coated substrate capable of reproducing the cell-ECM interaction between the receptors of cancer cells and the ligands of ECM matrices.
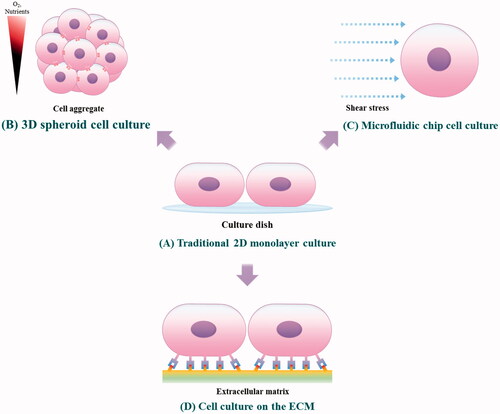
Figure 1. Microscopic images of 3D cancer spheroids. (A) T98G cells were cultured with SpheroFilmtr™ to obtain a 3D spheroid form, and the appearance of spheroids was confirmed by optical microscopy (scale bar: 200 μm). (B–D) To count viable whole cells and dead cells in a 3D spheroid, the spheroid was transferred onto a glass slide, mounted with a coverslip, stained with Hoechst and PI, and examined under a fluorescence microscope. (B) Hoechst nuclear staining confirmed the total number of cells. (C) Dead cells were identified among whole cells by PI staining. (D) An overlay of Hoechst and PI staining images. (E) Analysis of viability of 3D spheroid cells by fluorescence staining as a function of culture time.
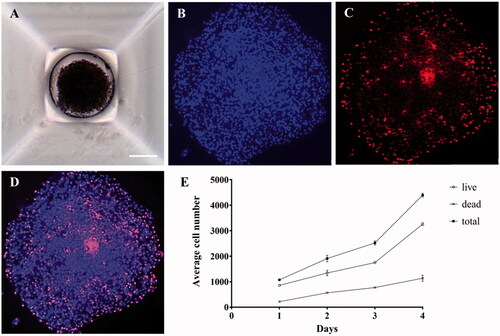
Figure 2. Microfluidic chip and cell culture images in microchannels. (A, B) A schematic diagram of the microfluidic chip and an image of the chip fabricated with PDMS. (C, D) Micrographs showing that T98G cells grow well in the PDL-coated microfluidic chip (scale bar: 200 μm).
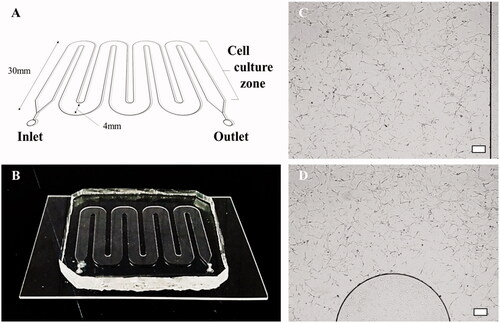
Figure 3. The chip for comparison of receptor- and charge-mediated adhesion of cancer cells. (A) Photograph of the wells made of PDMS to contain PDL, Matrigel solutionand culture media. The well was bonded with a glass slide to prevent potential leakage of solutions. (B) Micrographs of T98G cells cultured on a PDL-coated chip and (C) T98G cells cultured on a Matrigel-coated chip (scale bar: 200 μm).
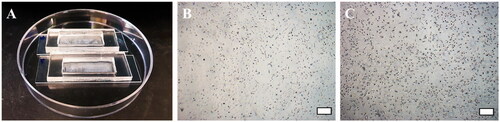
Figure 4. A comparison of cell growth rates depending on the culture platform. In the traditional 2D culture dish, microfluidic culture chip and ECM-coated platform, cells expanded by ∼15-fold in four days, while the 3D spheroids showed only a fourfold increase in cell number. These results demonstrate that the culture dimension (2D or 3D) can significantly affect the expansion rate of cancer cells. (****: p ≤ .0001)
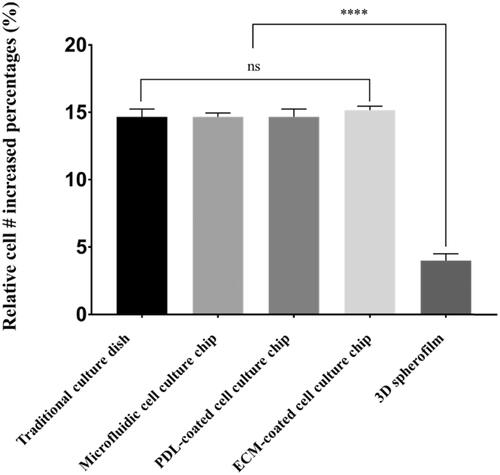
Figure 5. Changes in cell growth on each platform after DOX treatment. The growth of T98G cancer cells with and without DOX treatment. When treated with 1 μg/mL DOX, the cells cultured on the 2 D culture dish, PDL-coated microfluidic chip, and 3D spheroid film did not show growth, whereas T98G cells cultured on the Matrigel-coated chips showed marginal growth of 2.5-fold. In addition, when shear stress was administered in the presence of DOX, the cells lost their adhesion and were completely washed out. (**: p ≤ .01, ****: p ≤ .0001)
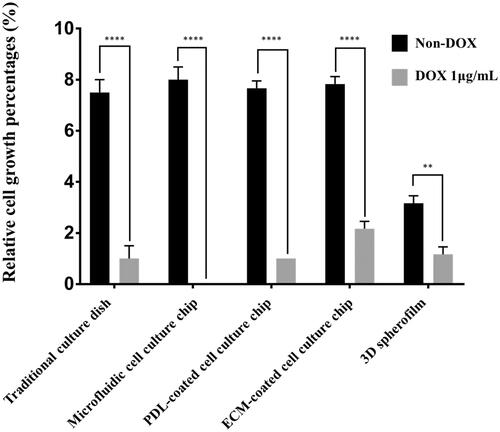
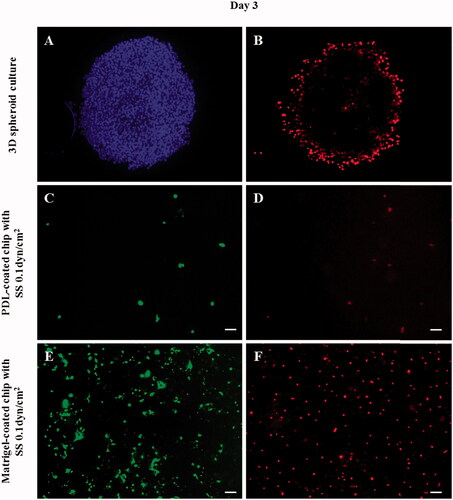
Figure 6. The morphological changes of T98G cells treated with 1 μg/mL DOX on the different cell culture platforms: a 2D cell culture plate, shear stress (SS) chip, PDL-coated chip or Matrigel-coated chip. When DOX treatment was administered, the cells did not proliferate in the culture dish; the lamellipodia and filopodia were not protruding from the cell body and the cell morphology changed to an aberrant form. In the microfluidic chip coated with PDL, T98G cells were almost completely washed out. This result suggests that the cells that lost their binding ability were separated by the flow. On the other hand, despite the DOX treatment in the Matrigel-coated chip, the morphology was unchanged and cell proliferation was observed (scale bar: 200 μm).
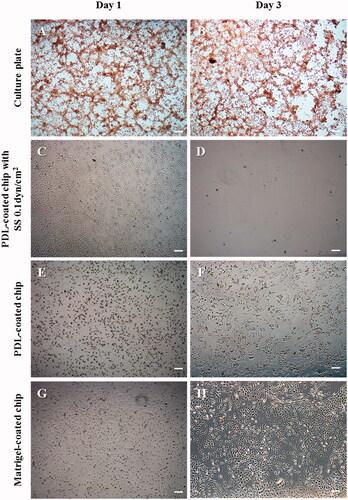
Figure 7. Fluorescent images of cancer cells in the 3D spheroid platform and in a microfluidic chip after DOX treatment. According to the fluorescent images, cancer cells in the 3D spheroid form showed a limited effect of DOX as confirmed by the increased cell number and PI-positive cell number. PI staining (B,D,F: dead cells) confirmed that only the cells of the outer layer of the 3D spheroid were dying, indicating that only the surface cells exposed to DOX were affected, whereas the interior cells were not affected. Additionally, in the presence of flow in the PDL-coated microfluidic channel, the cells were washed out. On the other hand, in the Matrigel-coated channel, cells demonstrated a relatively strong resistance to DOX even in the presence of flow. (A: nuclei/Hoechst, B,D,F: dead cells/PI, and C,E: live cells/Calcein-AM). (scale bar: 200 μm).