Figures & data
Figure 1. Structure of bromoacetylethyleneglycolferulate (BAEGF).
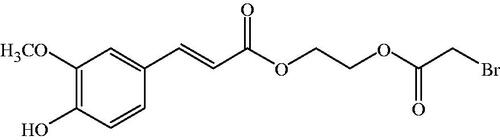
Figure 2. Reaction of Hb with 2-IT and the modification of BAEGF on Hb.
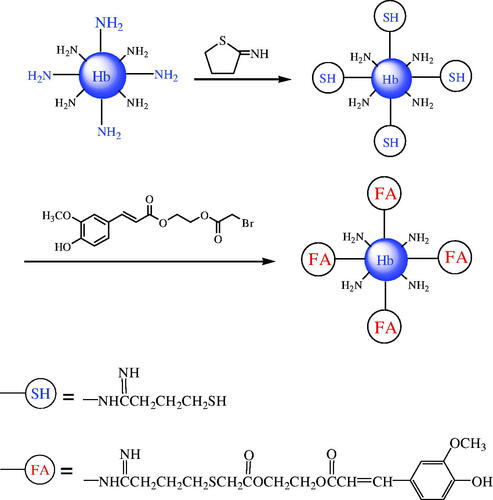
Figure 3. Calibration working curve of BAEGF.
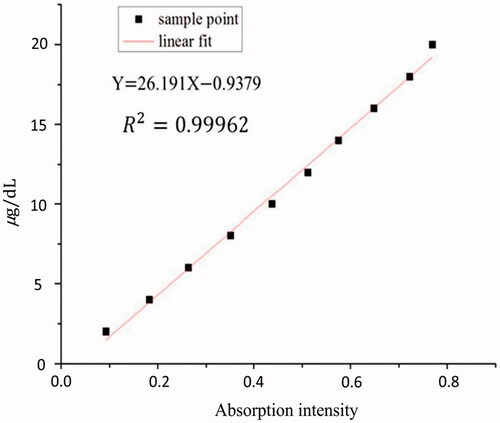
Figure 4. UV-vis wavelength scanning of Hb and FA-Hb.
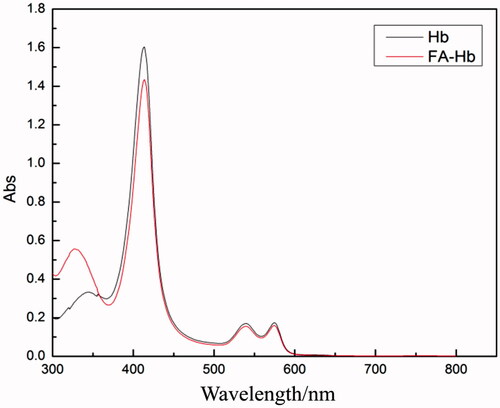
Table 1. Modification degree of FA after reaction of Hb with various dosage of 2-IT and BAEGF.
Figure 5. Oxygen-binding curves of native Hb (A) and FA-Hb (B) were measured using a Hemox analyzer at 37 °C in PBS, pH 7.4. Vertical axis is the fraction of haemoglobin sites to which oxygen is bound. The partial oxygen pressure at 50% saturation is expressed in mmHg.
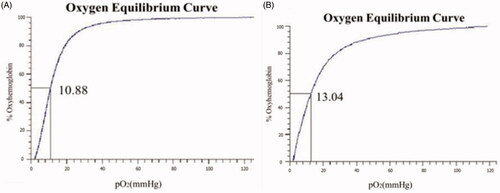
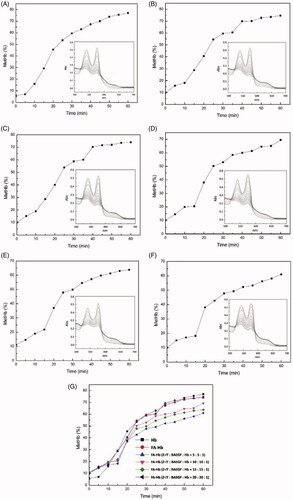
Figure 6. Time course of MetHb formation in Hb and various FA-Hb at 37 °C. (A) Hb; (B) FA-Hb (without 2-IT modification); (C) FA-Hb (2-IT:BAEGF:Hb = 5:5:1); (D) FA-Hb(2-IT:BAEGF:Hb =10:10:1); (E) FA-Hb (2-IT:BAEGF:Hb =15:15:1); (F) FA-Hb (2-IT:BAEGF:Hb =20:20:1); (G) the summary and comparison of autoxidation rate from (A)–(F). The inner charts of (A)–(F) represent the UV-vis spectrum of the corresponding product, respectively.
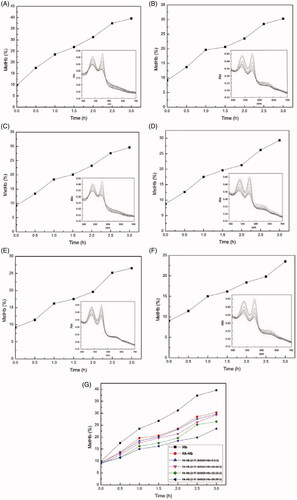
Figure 7. Time course of MetHb formation in Hb and various FA-Hb at 37 °C in the presence of xanthine–xanthine oxidase. (A) Hb; (B) FA-Hb (without 2-IT modification); (C) FA-Hb (2-IT:BAEGF:Hb = 5:5:1); (D) FA-Hb (2-IT:BAEGF:Hb =10:10:1); (E) FA-Hb (2-IT:BAEGF:Hb =15:15:1); (F) FA-Hb (2-IT:BAEGF:Hb =20:20:1); (G) the summary and comparison of autoxidation rate from (A)–(F). The inner charts of (A)–(F) represent the UV-vis spectrum of the corresponding product, respectively.