Figures & data
Scheme 1. Schematic representation for the synthesis of NGO-SPION-PLGA-5-Fu.
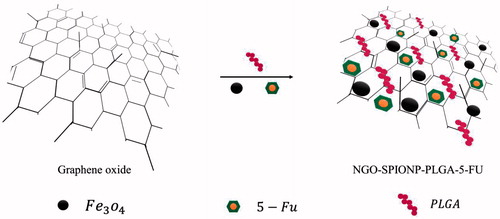
Figure 1. TEM images of the nanoparticles: (A) NGO-SPION-PLGA and (B) NGO-SPION-PLGA-5-Fu.
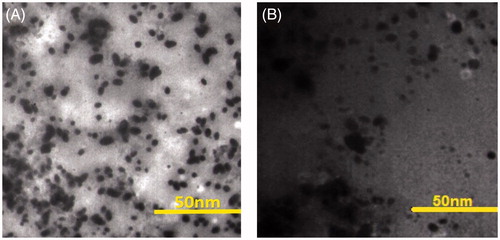
Table 1. Size and surface charge of nanoparticles.
Figure 2. The in vitro release profile of 5-Fu from NGO-SPION-PLGA-5-Fu. The plot represents the mean ± standard deviation of the results.
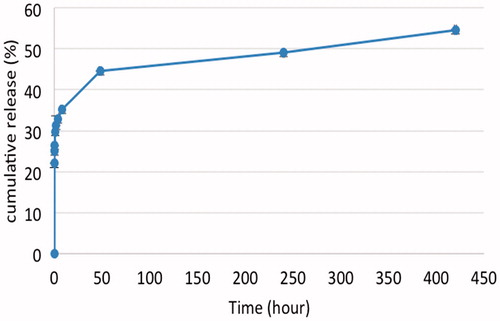
Figure 3. The mean plasma concentrations of 5-Fu following i.v. administration of 5-Fu and NGO-SPION-PLGA-5-Fu nanoparticles at a 5-Fu dose of 3 mg/kg.
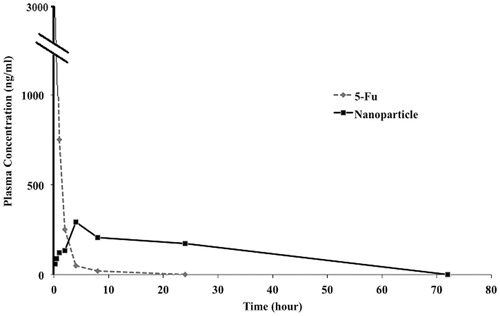
Figure 4. MRI scans of the mouse implanted with colon cancer (CT26 cell line): (A and C) coronal and sagittal scans before the injection of NPs and (B and D) coronal and sagittal scans, 120 min after the injection of NGO-SPION-PLGA nanoparticles. The new dark regions in the left tumour (indicated with an arrow) show the accumulation of magnetic-NGO after the application of a magnetic field.
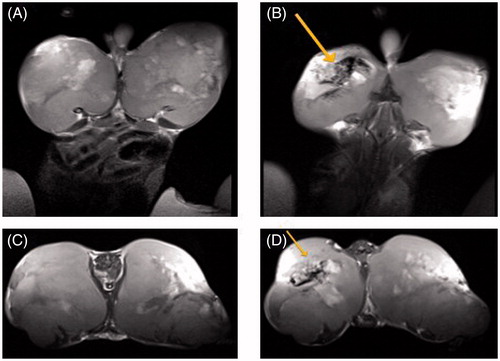
Figure 5. Laser irradiation and temperature measurement. (A) Effect of photothermal treatment using an 808 nm laser by an IR thermal imaging system. (B) Temperature changes by NIR (808 nm, 0.8 w/cm2) with and without NGO-SPION-PLGA as a function of time in mice implanted with colon cancer.
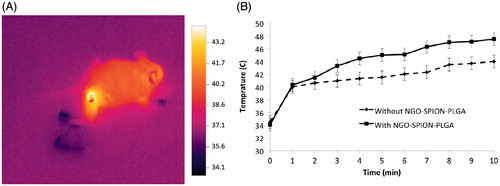
Figure 6. Tumour growth suppression effects of various treatment protocols against CT26 tumour. The data represent the means ± SD, n = 3.
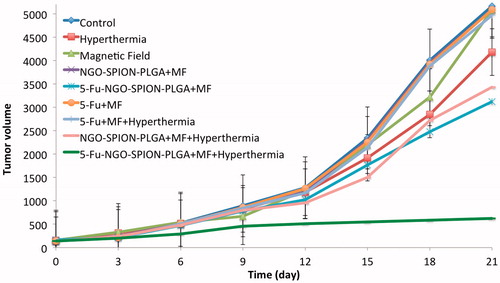
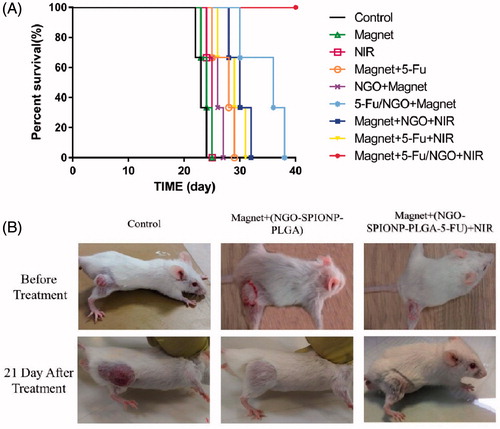
Figure 7. Effect of various treatments on survival of mice. (A) Kaplan–Meier survival curves of control and treated mice. (B) Representative photographs of tumours on mice after various treatments.