
Figures & data
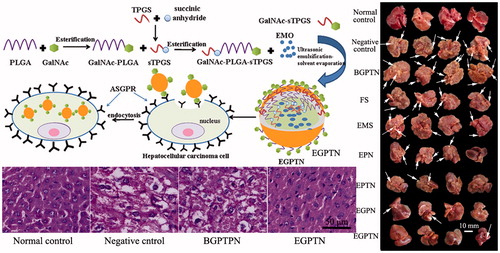
Scheme 1. Illustration on the synthesis of GalNAc-PLGA-sTPGS, preparation of EMO-loaded GalNAc-PLGA-sTPGS nanoparticles, and the active liver-targeting mechanism of ligand-receptor-mediated recognition on liver cancer cells.
Scheme 2. Illustration of the synthesis of GalNAc-PLGA-sTPGS polymer.
Figure 1. 1H-NMR spectra of GalNAc-PLGA-sTPGS, GalNAc-PLGA, PLGA-sTPGS, GalNAc-sTPGS, PLGA and TPGS copolymer and α-d-N-acetylaminogalactose (GalNAc).
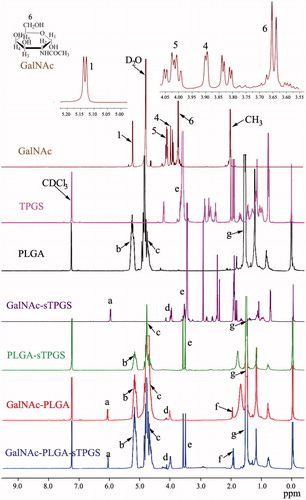
Figure 2. Characterization images of drug-loaded nanoparticles. A(a), A(b), A(c) and A(d) are TEM images of EMO-loaded PLGA nanoparticles (EPN), EMO-loaded PLGA-sTPGS nanoparticles (EPTN), EMO-loaded GalNAc-PLGA nanoparticles (EGPN) and EMO-loaded GalNAc-PLGA-sTPGS nanoparticles (EGPTN), respectively. B(a), B(b), B(c) and B(d) are TEM images of C6-loaded PLGA nanoparticles (CPN), C6-loaded PLGA-sPTGS nanoparticles (CPTN), C6-loaded GalNAc-PLGA nanoparticles (CGPN) and C6-loaded GalNAc-PLGA-sTPGS nanoparticles (CGPTN), respectively.
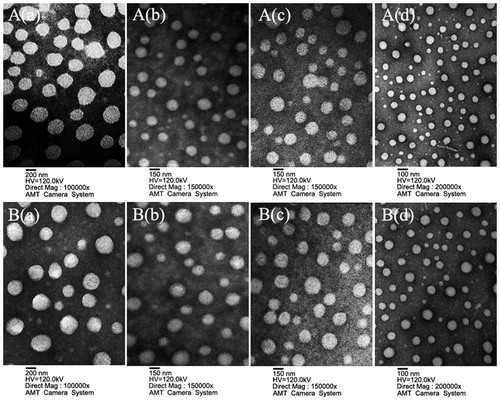
Table 1. Characterization of NPs. (n = 6, mean ± SD).
Figure 3. (A) The confocal laser scanning microscopy (CLSM) images of HepG2 cells after 30 and 60 min incubation with C6-loaded NPs suspensions, respectively. (B) The concentrations and cellular uptake rates of C6 in CPN, CPTN, CGPN and CGPTN internalized by HepG2 cells after incubation for 30 and 60 min, respectively (n = 6, mean ± SD; (a) p < .05 versus corresponding CPTN; (b) p < .01 versus corresponding CPN).
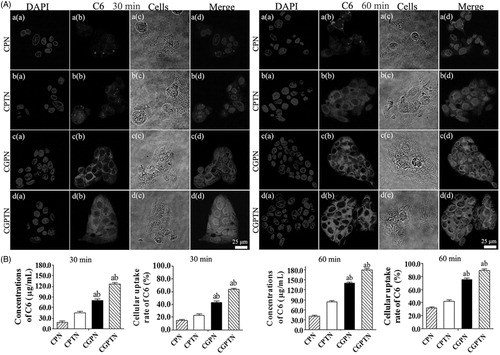
Figure 4. Effects of inhibitors on relative fluorescence intensity of CGPTN, CGPN, CPTN, CPN groups in HepG2 cells (n = 6, mean ± SD. (a) p < .05, (b) p < .01 versus corresponding CGPTN control group; (c) p < .05, (d) p < .01 versus corresponding CGPN control group; (e) p < .05, (f) p < .01 versus corresponding CPTN control group; (g) p < .05, (h) p < .01 versus corresponding CPN control group).
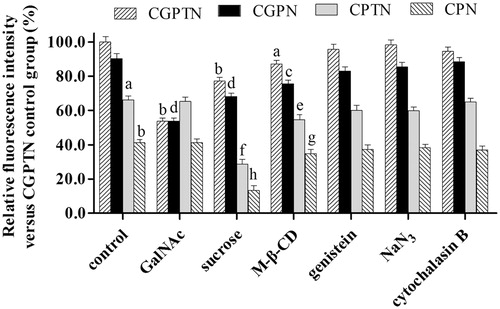
Figure 5. The fluorescence inversion microscope (FIM) images of apoptotic HepG2 cells induced by positive control (added DNase I), negative control (without any drug), BGPTN, FS, EMS, EPN, EPTN, EGPN and EGPTN after incubation for 24 and 72 h using TUNEL assays. Only apoptotic cellular nuclei displayed green fluorescence while all the nuclei were blue stained by DAPI.
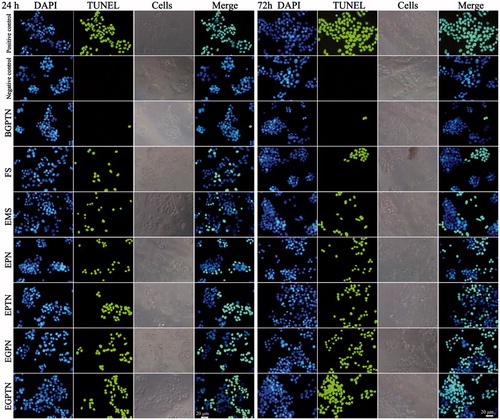
Table 2. Effect on apoptosis of HepG2 cells induced by FS, EMS, EPN, EPTN, EGPN and EGPTN after 24 and 72 h of incubation time in vitro (n = 3, mean ± SD).
Figure 6. (A) Representative images of excised livers from the normal control and primary liver cancer (PLC) mice treated with 20% (v/v) PEG400-normal saline solution (negative control), BGPTN, FS, EMS, EPN, EPTN, EGPN and EGPTN groups, respectively. (B)Tumour nodules in liver of PLC mice treated with 20% (v/v) PEG400-normal saline solution (negative control), BGPTN, FS, EMS, EPN, EPTN, EGPN and EGPTN groups after 30 days (n = 8, mean ± SD. (a) p < .05 versus corresponding EGPN group; (b) p < .01 versus corresponding EGPTN group). (C) The representative liver slices of each group stained with H&E and observed using microscope (400×). C(a–i) are H&E images of the normal control, negative control, BGPTN, FS, EMS, EPN, EPTN, EGPN and EGPTN groups, respectively.
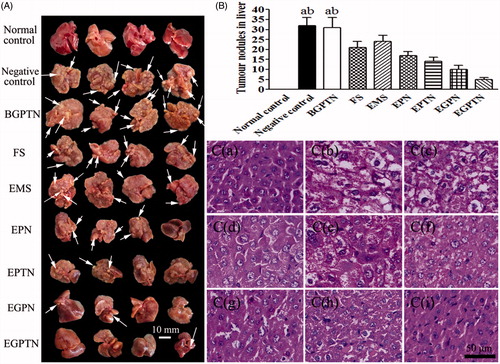
Table 3. Liver functional indexes in the serum and liver of the primary liver cancer mice (n = 8, mean ± SD).