
Figures & data
Table 1. Characteristics of the groups under study.
Figure 1. Transmission electron microscopy (TEM) image of calcium carbonate nanoparticles.
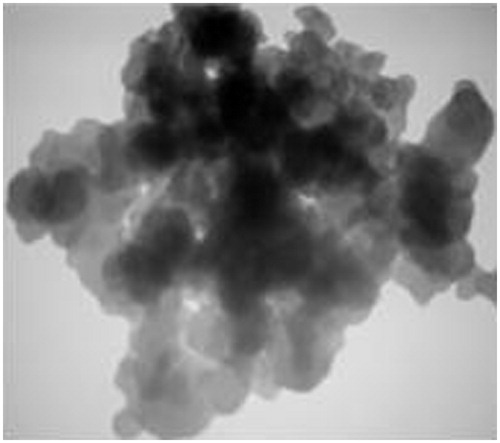
Figure 2. Standard curve of calcium carbonate nanoparticle (CC NPs) uptake into the MCF-7 cells in concentrations of 50 to 200 μg/mL.
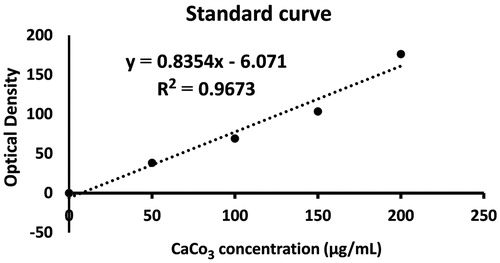
Table 2. Mean ± standard deviations (SD) of optical densities and apoptosis in the groups under study.
Figure 3. Effects of hyperthermia (H), radiation (R), calcium carbonate nanoparticles (NPs) and doxorubicin, as positive control (PC), on the cell viability of MCF-7 cells in the studied groups. The values were normalized to those of negative control group. The Figure abbreviations are provided in . The following groups had significant differences (p < .05) as follows: NC and H with the groups labelled (A). NP1 with the groups labelled (B). R, R + H, NP1 + H and NP1 + R with the groups labelled (C). NP2 with the groups labelled (D). NP1 + R + H, NP2 + R, NP2 + H, NP3 and NP2 + R + H with the groups labelled (E). NP3 + H, PC1 and NP3 + R with the groups labelled (F).
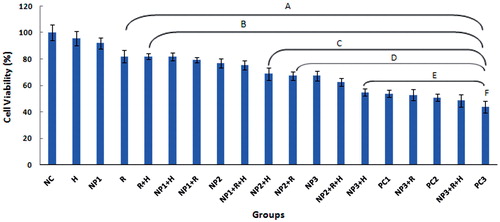
Figure 4. The assessment of MCF-7 apoptosis by propidium iodide/acridine orange staining. The green cells with diffused chromatin are viable (A), the red cells with no condensed chromatin are necrotic (B) and the cells with condensed chromatin are apoptotic (C).
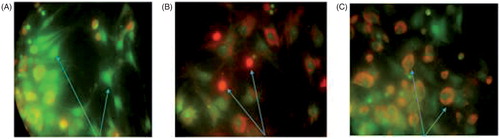
Table 3. Mean ± standard deviations (SD) of caspase-3, -8, and -9 activities in the groups under study.