Figures & data
Figure 1. Characterization of the bFGF-lip. (A) Size distribution of the liposomes; (B) size distribution of the bFGF-lip; (C) representative TEM micrographs of the bFGF-lip; (D) in vitro cumulative release of CoQ10 from bFGF-lip.
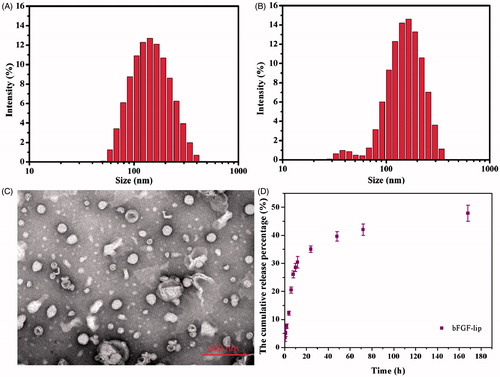
Figure 2. Effects of bFGF-lip + UTMD on left kidney dimensions and function. (A) CEUS images of TIC curve in normal rats and early DN rats at week 4; (B) the images of left kidney size from two-dimensional ultrasound; (C) the images of renal blood signal from Doppler ultrasound; (D, E, F, G) The statistics of left kidney volume, peak systolic velocity (VS), end-diastolic velocity (VD) and the resistance index (RI). N = 6 per group. *p < .05, **p < .01 and ***p < .001 versus the DN group, #p < .05, ##p < .01 and ###p < .001 versus the bFGF-lip + UTMD group.
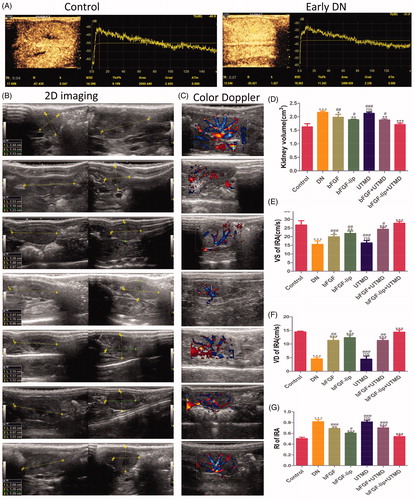
Figure 3. Effects of bFGF-lip + UTMD on renal histopathological morphology and the content of bFGF in kidney combined with UTMD. (A) Haematoxylin–eosin staining of kidney; (B) Western blot analysis of bFGF; (C) quantitative analyses of bFGF. N = 6 per group. Data are expressed as the mean ± SD. *p < .05, **p < .01 and ***p < .001 versus the bFGF group.
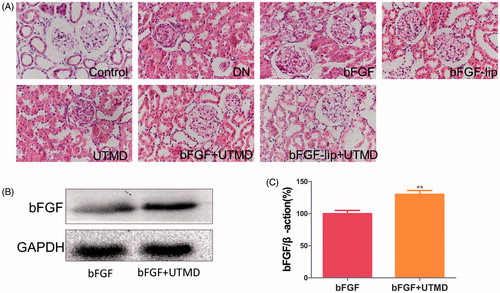
Figure 4. Effects of bFGF-lip + UTMD on NF-kb, TGF-β1, MCP-1, IL-6 and IL-1β release. (A) Immunohistochemistrical staining of NF-κB, TGF-β1, MCP-1, IL-6 and IL-1β; (B) quantitative analyses of renal NF-κB, TGF-β1, MCP-1, IL-6 and IL-1β immunohistochemistry, N = 6 per group. Data are expressed as the mean ± SD. *p < .05, **p < .01 and ***p < .001 versus the DN group, #p < .05, ##p < .01 and ###p < .001 versus the bFGF-lip + UTMD group.
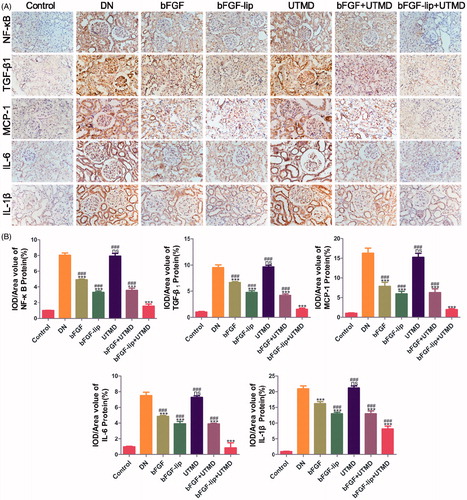
Figure 5. Effects of bFGF-lip + UTMD on cells apoptosis of kidney. (A) Immunohistochemistrical staining of caspase-3; (B) quantitative analyses of renal caspase-3 immunohistochemistry; (C) Western blot analysis of renal Bax and Bcl-2 protein expression; (D) quantitative analyses of Bcl-2/Bax; (E) immunofluorescent staining of TUNEL (green staining). N = 6 per group. Data are expressed as the mean ± SD. *p < .05, **p < .01 and ***p < .001 versus the DN group, #p < .05, ##p < .01 and ###p < .001 versus the bFGF-lip + UTMD group.
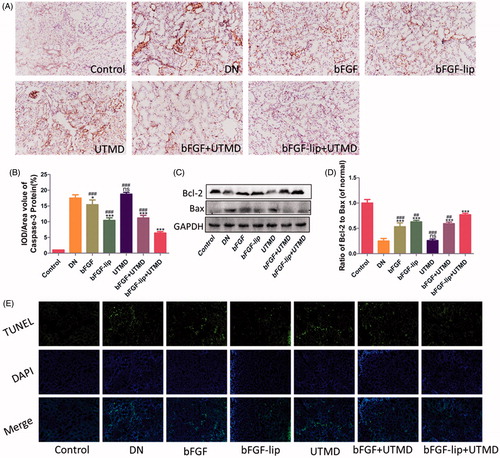
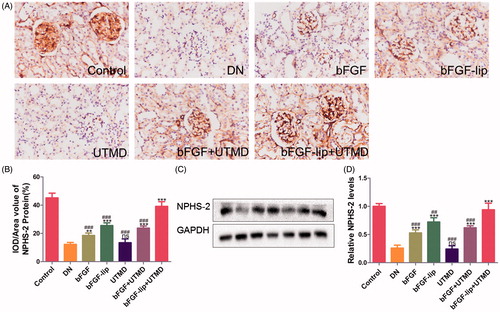
Figure 6. Effects of bFGF-lip + UTMD on expression of Nphs2 levels. (A) Immunohistochemistrical staining of Nphs2; (B) quantitative analyses of Nphs2 immunohistochemistry; (C) Western blot analysis of Nphs2 protein expression; (D) quantitative analyses of Nphs2 expression. N = 6 per group. Data are expressed as the mean ± SD. *p < .05, **p < .01 and ***p < .001 versus the DN group, #p < .05, ##p < .01 and ###p < .001 versus the bFGF-lip + UTMD group.