Figures & data
Figure 1. Preparation and cell proliferation studies of solid, hollow and porous PHBVHHx microspheres, respectively (abbreviated as SMSs, HMSs and PMSs). (1) a1, b1 and c1 demonstrate how PHBVHHx SMSs, HMSs and PMSs were prepared via methods of oil-in-water (O/W), water-in-oil-in-water (W1/O/W2) double emulsion, and improved gas-in-oil-in-water (G1/O/W2) double emulsion in this study, respectively. (2) a2, b2 and c2 reveal section structures of the SMS, HMS or PMS. (3) a3, b3, a4 and b4 show cells grow only on surface of SMS and HMS, while c3 and c4 indicate cells grow both on the surface and into the internal structures of PMSs via surface open pores. Frame (1#) indicates a model of cell’s migration from surface to inner of PMS along these big pores. Frame (2#) indicates another model of cell’s carpetliked coverage on surface of PMSs. DCM: dichloromethane.
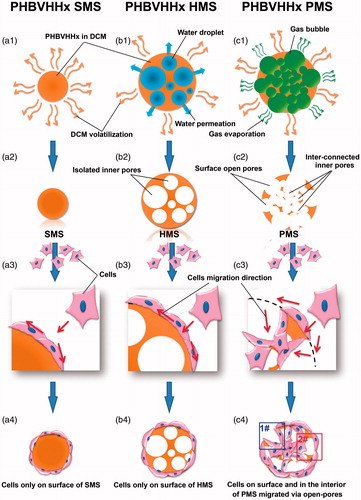
Figure 2. SEM observation of PHBVHHx SMSs, HMSs and PMSs, respectively.
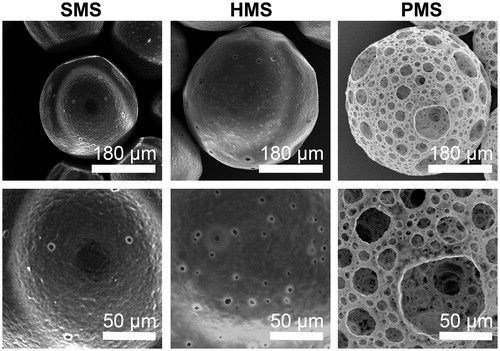
Figure 3. Characterizations of PHBVHHx SMSs, HMSs and PMSs, respectively. (a–c) Microsphere size distribution; (d) Microsphere diameter distributions of internal pores and (e) Microsphere water uptake ratio (WUR). The WURs of microspheres were calculated using 6 parallel samples for each data, ***p < .005 (n = 6 or 300). The diameters of approximately 300 surface pores and 300 inner pores from 20 randomly selected microspheres were collected for each sample (n = 300). Surface pores below 5 μm in size of PMSs were ignored.
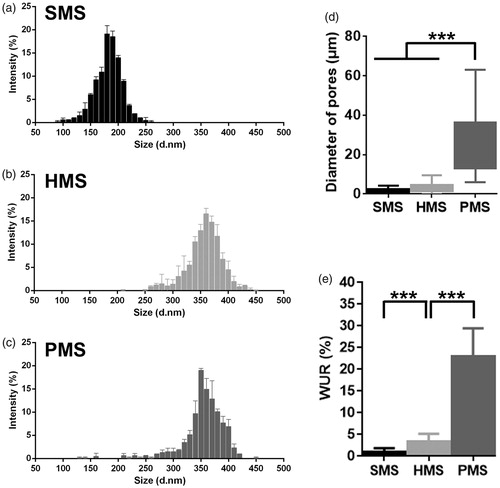
Figure 4. SEM sections of PHBVHHx SMSs, HMSs and PMS, respectively.
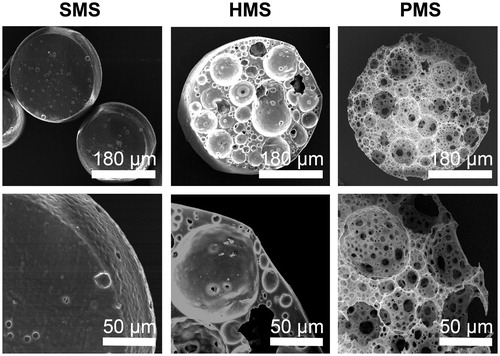
Figure 5. Cell attachments and proliferation on/in PHBVHHx SMSs, HMSs and PMSs, respectively. (a) Laser scanning confocal images of cells cultivated on/in PHBVHHx SMSs, HMSs and PMSs on days 2, 4 and 6, respectively. (b) Cell attachments for 12 h and (c) Cell proliferations for 6 days. n.s.: no significant difference; *p < .05; **p < .001; ***p < .005 (n = 6). LC indicates a large proportion of cells leaving their original positions to expose the microsphere surfaces. The sections of PMSs, SMSs and HMSs loaded with cells were prepared via WEI FOSM.
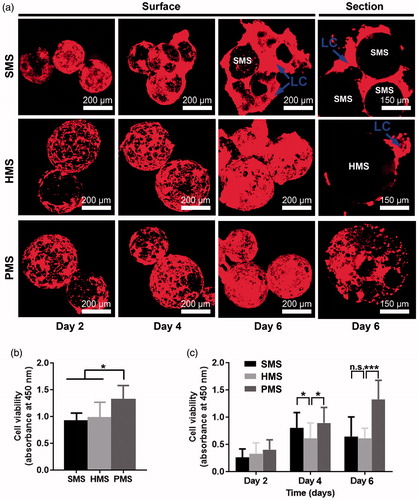
Figure 6. SEM studies of cells proliferating on PHBVHHx SMSs, HMSs and PMSs, respectively. C indicates cells adhering on surface of microspheres. CC shows carpet-liked cell growth on surface of PMS on day 6. MC indicates cell migration into internal spaces of PMS via large surface pores. R points to the rift-liked structures on surface of HMS and SMS. LC indicates a large proportion of cells leaving their original positions to expose the microsphere surfaces.
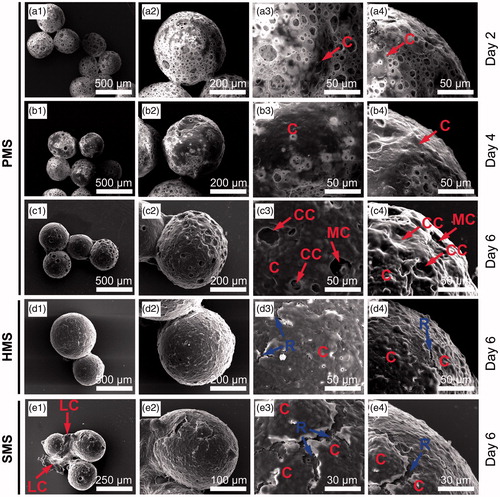
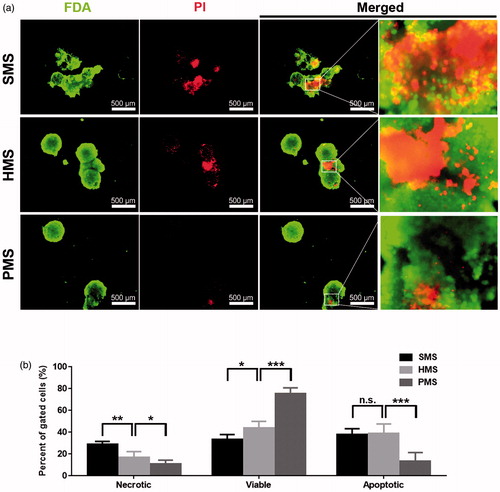
Figure 7. Apoptotic studies of cells proliferated for 6 days on solid, hollow and highly open porous PHBVHHx microspheres, respectively (abbreviated as SMSs, HMSs and PMSs). (a) The in-situ observation of living, dead or apoptotic cells on microspheres stained with FDA and PI under a fluorescence microscope and (b) comparison of percent of viable, necrotic, apoptotic cells on microspheres, respectively. n.s.: no significant difference; *p < .05; **p < .001; ***p < .005 (n = 4).