Figures & data
Table 1. Composition of formulations used for aqueous solution to be spray dried.
Figure 1. SEM of spray-dried MS.
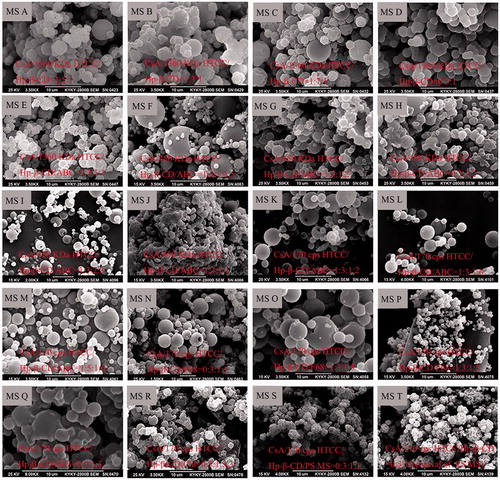
Figure 2. The geometric diameter determined via dynamic light scattering. (A) The MVDs of different MS. Bars represent standard errors of three replications. Different letters indicate significant differences (p < .05) according to Duncan’s multiple range tests; (B) the size distribution by intensity of MS I.
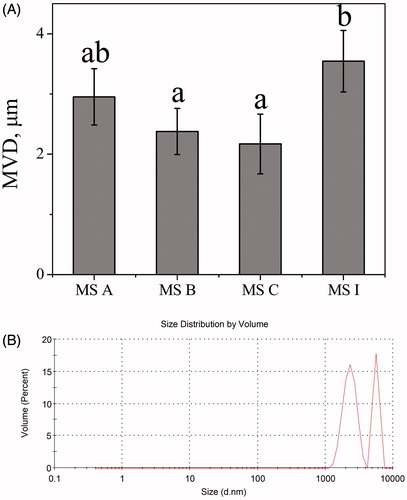
Figure 3. Spectra analyses of CsA, HTCC, Hp-β-CD, blank microsphere MS D, MS A, MS B, MS C and MS I. (A) FT-IR spectra; (B) DSC spectra; (C) XRD spectra.
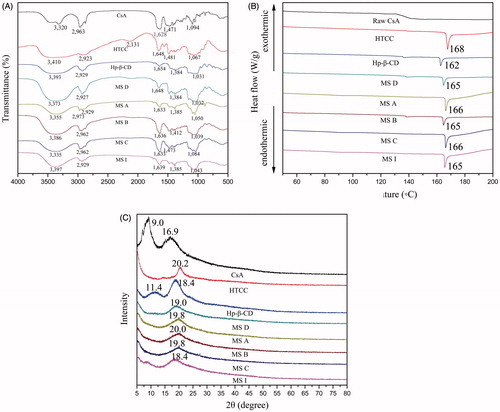
Table 2. Accuracy and precision of the analyses of CsA (n = 5).
Figure 4. EE (A) and DL (B) of MS A, MS B, MS C and MS I. Bars represent standard errors of three replications. Different letters indicate significant differences (p < .05) according to Duncan’s multiple range tests.
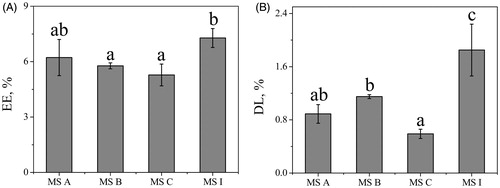
Figure 5. Aerosol dispersion performance properties containing deposition on stages (A), ED (B), FPF (C), RF (D), GSD (E) and MMAD (F). Bars represent standard errors of three replications. Different letters indicate significant differences (p < .05) according to Duncan’s multiple range tests.
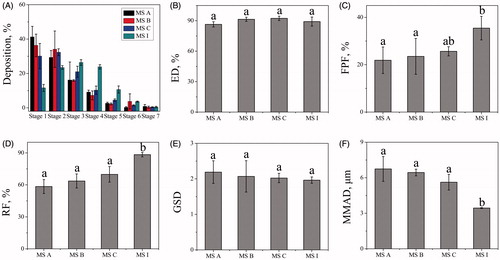
Figure 6. In vivo biocompatibility including assay for protein (A) and LDH (B) in BALF on acute lung toxicity, and the microscopic structure of mucosa cells (C) and lasting time of ciliary movement (D) on ciliotoxicity study of in situ toad palate model. For acute lung toxicity, bars represent standard errors of four replications, and “*” compared with Triton X-100 group (p < .05) was observed according to a two-tailed paired t-test. For ciliotoxicity study, bars represent standard errors of six replications, and “Δ” compared with NS group (p < .05) was observed according to a two-tailed paired t-test.
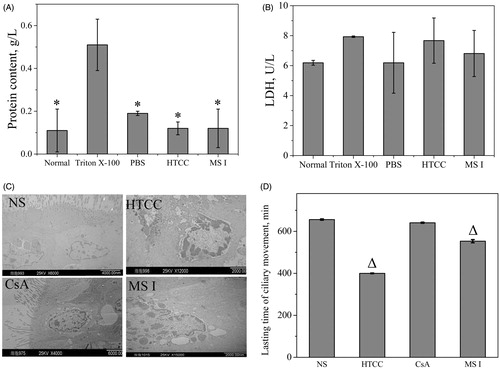
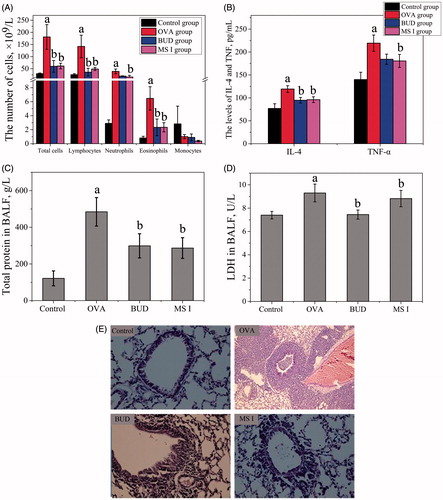
Figure 7. In vivo efficacy in the asthmatic rat model including effects of MS I on OVA-induced total and differential leukocytes in BALF (A), effects of MS I on OVA-induced levels of IL-4 and TNF-α (B), effects of MS I on OVA-induced levels of total protein (C) and LDH (D) in BALF, and effects of lung histopathological changes. Bars represent standard errors of five replications. “a” compared with the control group (p < .05) was observed according to a two-tailed paired t-test. “b” compared with the OVA-treated group (p < .05) was observed according to a two-tailed paired t-test.