
Figures & data
Table 1. Composition of nisoldipine-loaded NLCs, SLNs and suspension formulation.
Table 2. Physical characters – size, PDI, ZP, drug content and EE of ND-NLCs and SLNs formulations (mean ± SD, n = 3).
Figure 1. In-vitro drug release of ND from ND-NLCs, ND-SLNs and NDS in 0.1 N HCl followed by pH 6.8 phosphate buffer (mean ± SD, n = 3).
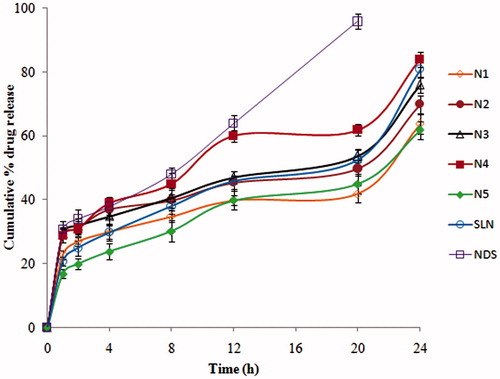
Table 3. Effect of storage at refrigerated and room temperature on size, PDI, ZP, assay and EE of optimized NLCs (N4) formulation for 3 months (mean ± SD, n = 3).
Figure 2. Drug permeation profiles of ND from ND-NLCs, ND-SLNs and NDS by in-situ absorption studies in rat intestine (mean ± SD, n = 3).
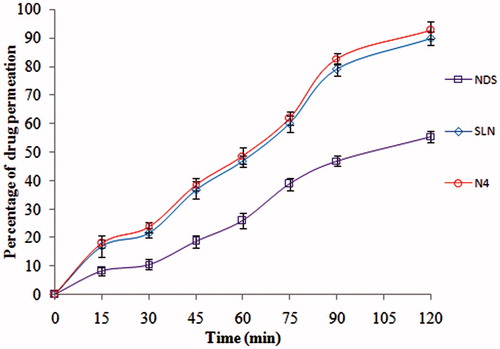
Table 4. Release coefficients and kinetic parameters of drug permeation studies of nisoldipine from ND-NLCs, SLNs and NDS formulation across rat intestine (mean ± SD, n = 3).
Figure 3. DSC thermograms of (A) pure nisoldipine, (B) pure lipid, (C) physical mixture of ND and lipid (1:1 ratio), (D) lyophilized ND-NLCs and (E) lyophilized ND-SLNs.
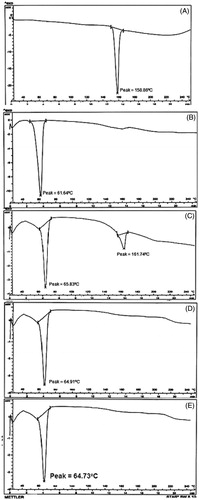
Table 5. Degree of crystallinity of pure drug, physical mixture and lyophilized NLCs and SLNs formulation.
Figure 4. XRD spectra of (A) pure nisoldipine, (B) pure lipid, (C) physical mixture of ND and lipid (1:1 ratio), (D) lyophilized ND-NLCs and (E) lyophilized ND-SLNs.
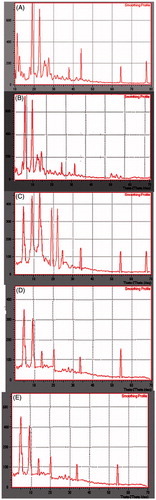
Figure 5. SEM images of optimized ND-NLCs at different magnifications.
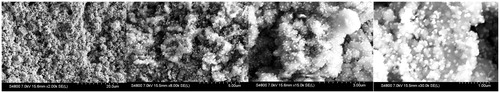
Figure 6. Pharmacokinetic (PK) profiles of nisoldipine in rat serum following oral administration of ND-NLCs (N4), optimized SLNs and NDS formulation (mean ± SD, n = 6).
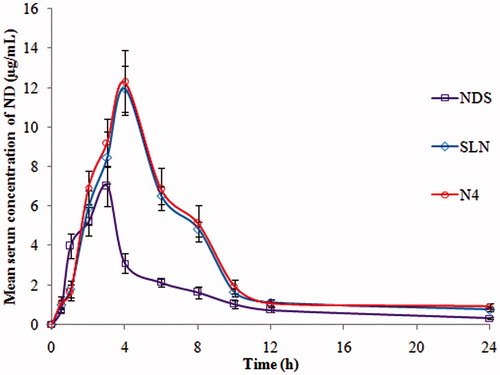
Table 6. Pharmacokinetic parameters of nisoldipine after oral administration of ND-NLCs, SLN and NDS in rats (mean ± SD, n = 6).