Figures & data
Figure 1. Polymerization scheme of GA-HA-SS-Cur.
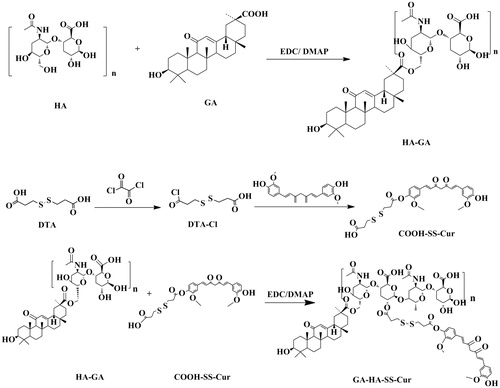
Figure 2. Schematic structure of GA-HA-SS-Cur and mPEG-DSPE self-assembly into nano-echinus and the drug released from nano-echinus under reduction- environment of tumour cells.
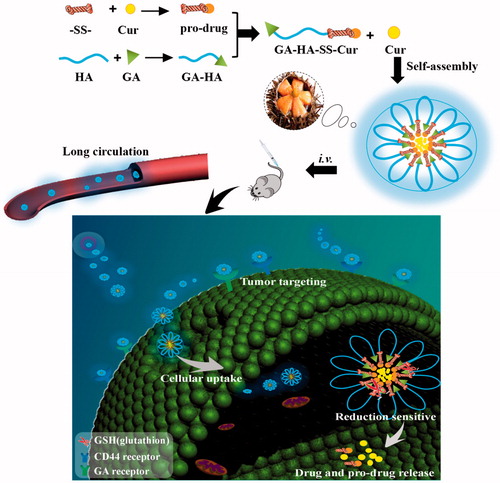
Figure 3. The 1H-NMR spectra of GA-HA-SS-Cur.
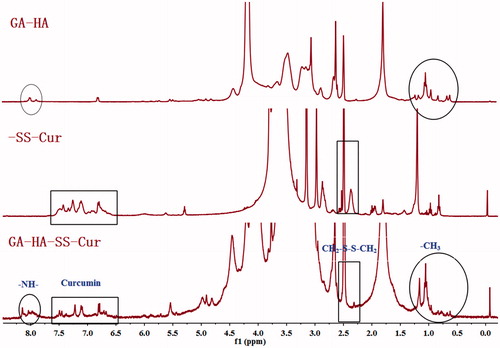
Figure 4. (A) The nano-echinus with PBS; (B) The size distribution of the nano-echinus; (C) The Zeta Potential of the nano-echinus; (D) The TEM images of nano-echinus.
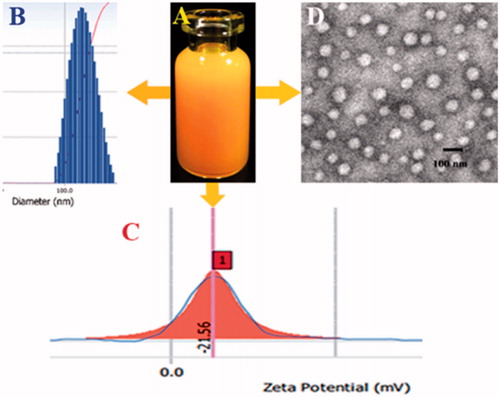
Table 1. Characterization of the nano-echinus and its drug loading capacity.
Figure 5. (A) In vitro release profiles of Cur from the nano-echinus in medium containing 0, 2 mM, 10 mM of GSH. (B) In vitro cytotoxicity of mPEG-DSPE, GA-HA, Free Cur, the nano-echinus. (C) 2D- and 2.5D-reconstructed FM images of cellular uptake. (D) Internalization imaging of nano-echinus in cancer cells after 3 h incubation. Hoechst 33342 was used to stain the cell nucleus which showed blue fluorescence.
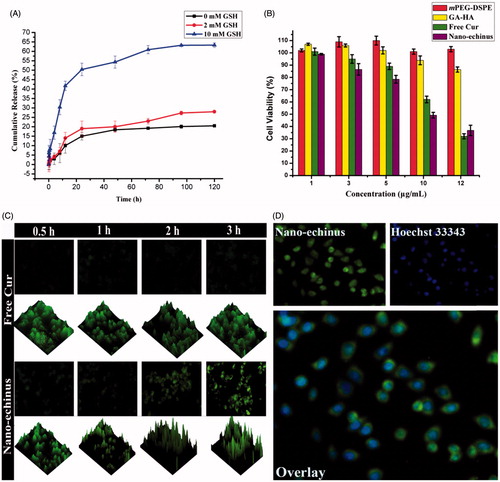
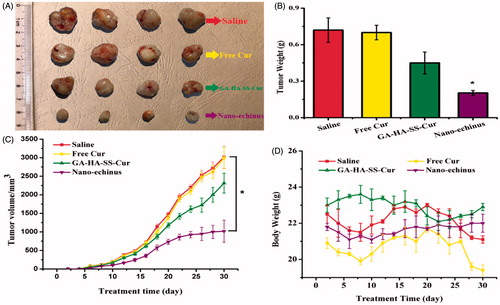
Figure 6. (A) Photographs of tumours. (B) The growth of tumours (*p < .05 vs. saline group). (C) Tumour weight (*p < .05 vs. saline group). (D) Body weights in different groups after treatments.