Figures & data
Scheme 1. Synthesis of Dx-CD-FA.
Figure 1. (A) X-ray diffraction patterns of as-prepared MNPs, FDNPs and DNPs. (B) Energy-dispersive X-ray spectrum of as-prepared MNPs. (C) Particle size distribution of DNPs observed from dynamic light scattering. (D) Particle size distribution of FDNPs observed from dynamic light scattering. (E) Transmission electron microscopic image of DNPs. (F) Transmission electron microscopic image of FDNPs.
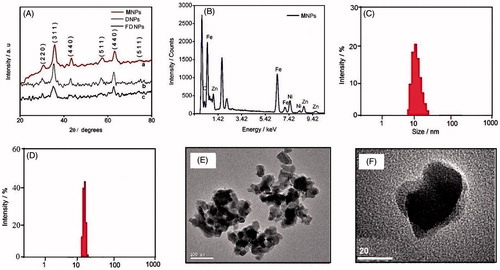
Figure 2. (A) X-ray photoelectron spectra of MNPs. (B) Thermogravimetric curves of DNPs and FDNPs. (C) Magnetization curves of DNPs, MNPs and FDNPs.
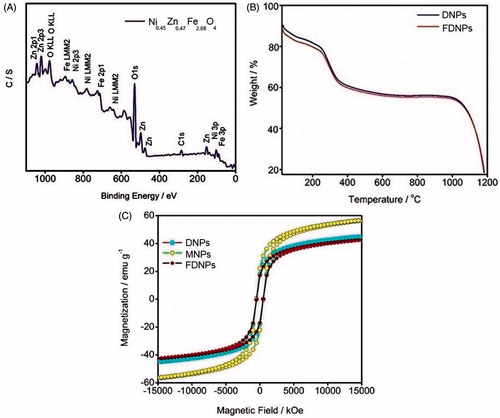
Figure 3. (A) IR spectrum of FA-CD-Dx. (B) 1H NMR spectrum of FA-CD-Dx. (C) Proton numbering in dextran and β-CD.
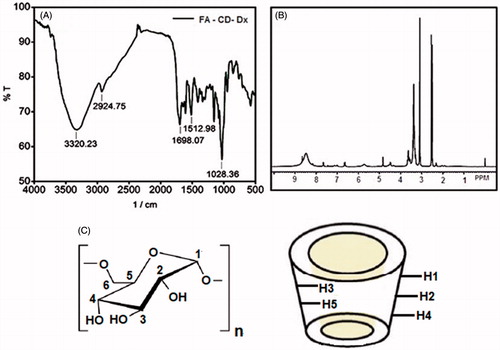
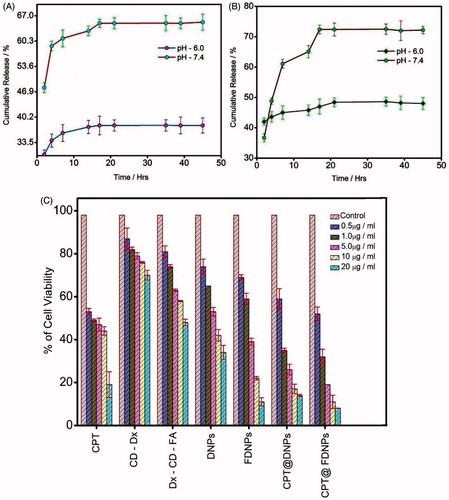
Figure 4. Release profile of CPT loaded on (A) DNPs and (B) FDNPs under the conditions of pH 7.4 and 6.0, respectively, at room temperature. (C) Cell viability of Hela cell evaluated by MTT assay, after 24-h treatment of CPT, the carriers and drug-loaded carriers.
Scheme 2. Summary of the work carried out. Ni–Zn ferrite magnetic nanocarrier coated with Dx-CD-FA is shown in which CPT is loaded.