Figures & data
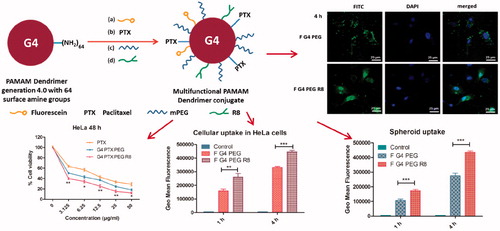
Figure 1. Schematic representation of the synthesis of multifunctional G4 dendrimer conjugate.
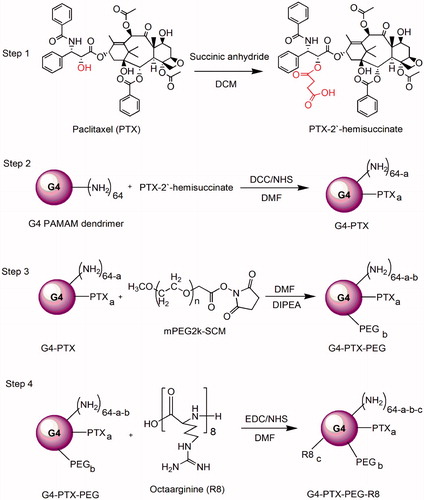
Figure 2. 1H NMR spectrum of (A) G4-PTX-PEG and (B) G4-PTX-PEG-R8 in D2O at 300 MHz.
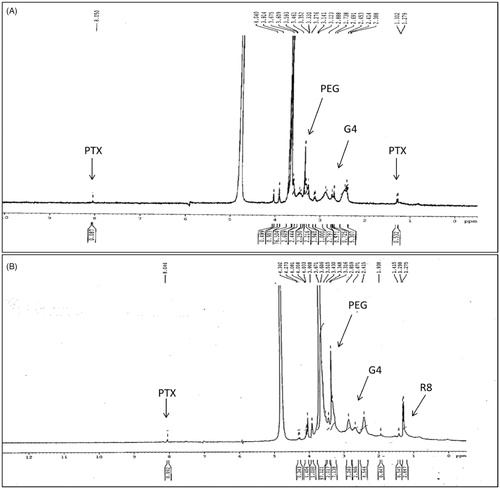
Table 1. Zeta potential values of multifunctional dendrimer conjugates (mean ± SD, n = 3).
Figure 3. Percentage of hemolysis obtained from the interaction of the G4 conjugates with RBC suspension. Data is represented as mean ± SD, n = 3. Statistical significance was determined for G4 PEG and G4 PEG R8 against plain G4 dendrimer.
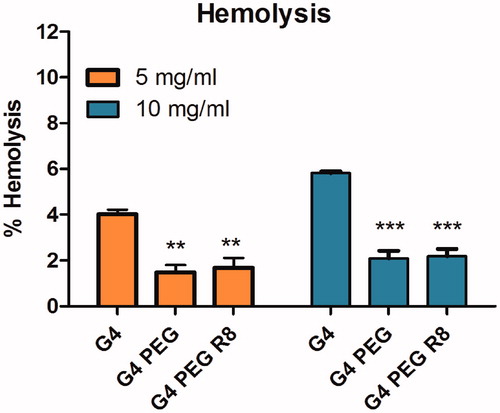
Figure 4. (A) Confocal microscopy images of HeLa cells after 1 and 4 h of incubation with F-G4-PEG and F-G4-PEG-R8. (B) Cellular uptake of fluorescently tagged G4 conjugates with and without R8 modification in HeLa cells after 1 and 4 h incubation as assessed by flow cytometer (mean ± SD, n = 3).
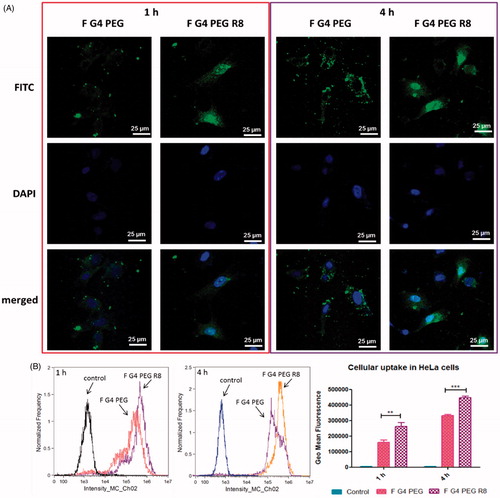
Figure 5. Percentage cell viability of HeLa cells treated with different concentrations of PTX, G4-PTX-PEG and G4-PTX-PEG-R8 at 24 and 48 h (mean ± SD; n = 3).
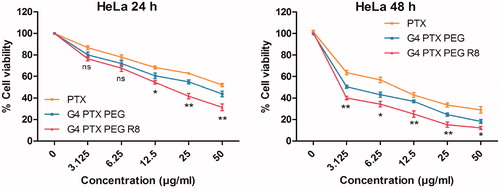
Figure 6. Quantitative estimation of apoptosis induced by various PTX treatments as studied by AnnexinV FITC/PI staining assay. Q1: live cells; Q2: early apoptotic; Q3: late apoptotic; Q4: necrotic cells.
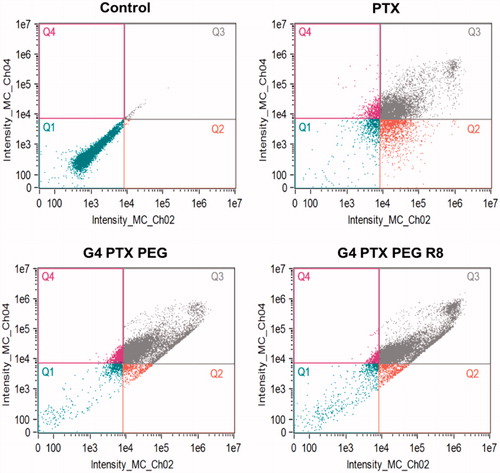
Figure 7. (A) Penetration of G4 conjugates in 3D cultured spheroids at various depths after 1 and 4 h incubation captured as Z-stacks by confocal microscopy. (B) Quantitative assessment of cellular uptake in 3D spheroids treated with F-G4-PEG and F-G4-PEG-R8 by flow cytometry (mean ± SD; n = 3).
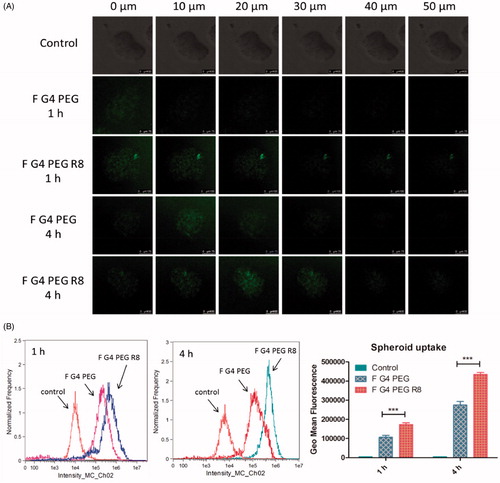
Figure 8. (A) Photomicrograph of spheroids after different PTX treatments captured at Day 0, Day 3 and Day 6 using bright field microscope at 10× magnification. (B) Graphical representation of spheroid growth inhibition (mean of diameter in µm ± SD; n = 3).
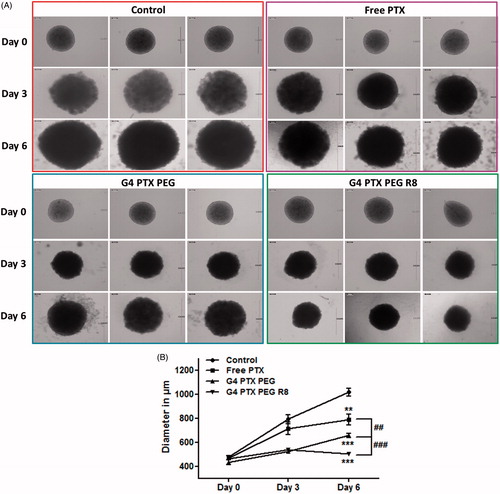
Figure 9. In vitro cytotoxicity induced by PTX, G4-PTX-PEG and G4-PTX-PEG-R8 at 24 h in tumor spheroids as assessed by Presto blue assay (mean of percentage cell viability ± SD; n = 3).
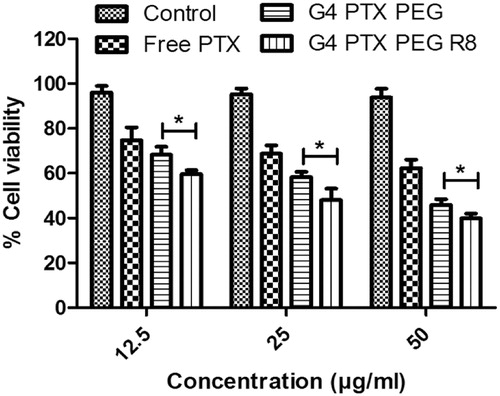
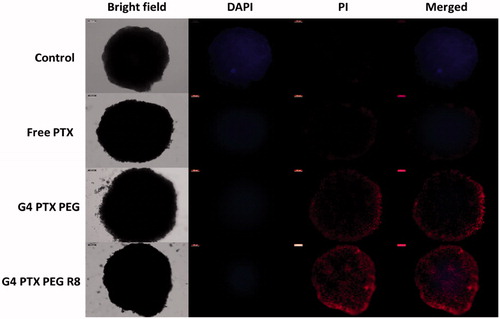
Figure 10. Live/dead cell micrographs of tumor spheroids captured using fluorescence microscope at 10× magnification.