Figures & data
Table 1. The controllable parameters and their variation levels.
Table 2. The basic taguchi L9(33) orthogonal array and results for individual responses.
Table 3. Orthogonal array and signal to noise ratio for each response.
Figure 1. The S/N ratios of controlled parameters for size (A); zeta potential (B); PDI (C); and zeta deviation (D).
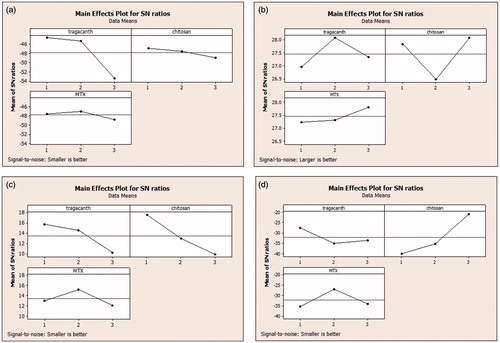
Table 4. The ANOVA results for responses.
Figure 2. A; the release profile of nanoparticles at optimum conditions. B; the TGA thermograms of chitosan, DET, physical mixture, and drug-loaded nanoparticles. C; the TEM photograph of nanoparticles obtained at optimum condition.
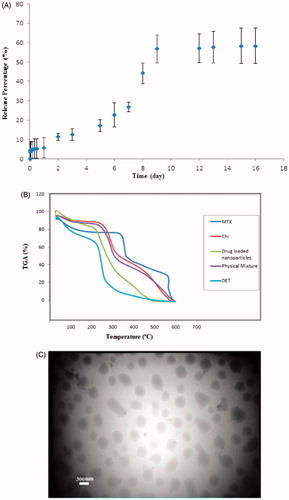
Figure 3. A–D; relative cell viability of free methotrexate (MTX), MTX loaded nanoparticles (MTX loaded DET-CS NPs) evaluated on HT-29 (A and B) and MCF-7 (C and D) cells at 24 (A and C) and 72 h (B and D). Used concentrations were 31, 62.5, 125, 250 and 500 µg/mL for free MTX and MTX loaded NPs, and the concentration of blank nanoparticles was same as ones for the drug-loaded NPs. The relative cell viability read for the control (tissue culture polystyrene from culture plates) after 24, and 72 h of incubation was taken as the reference (100%). Data are expressed as the mean ± SEM of three separate experiments. Significance was calculated by ANOVA (*p ≤ .05).
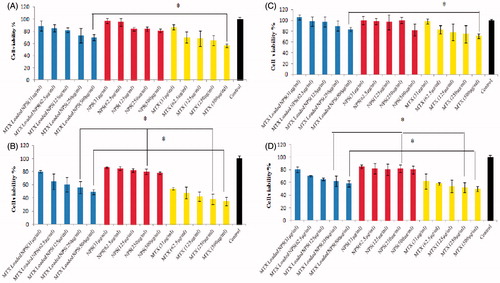
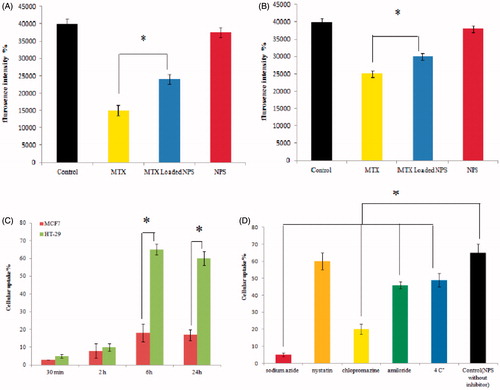
Figure 4. A & B; the Effect of MTX, MTX loaded DET-CS nanoparticles and blank nanoparticles at different concentration on mitochondrial membrane potential (MMP) collapse after 48 h, as detected by Rhodamine 123 using plate reader in HT-29 (A) and MCF-7 (B). C & D; the cellular uptake of DET-CS nanoparticles after 30 min, 2, 6 and 24 h on HT-29 and MCF-7 (C). The uptake of DET-CS nanoparticles after exposure to uptake inhibitors (sodium azide, nystatin, chlorpromazine, amiloride and at 4 °C) after six h (D). Data are expressed as the mean ± SEM of three separate experiments. Significance was calculated by ANOVA (*p ≤ .05).