Figures & data
Figure 1. The rats are divided into 3 groups each receives 4 weekly infusion of one of the following samples: lactated ringer’s solution (LR) as control group, bovine polySFHb (Phe) and bovine poly-[Hb-CAT-SOD-CA] (PHE) with enhanced enzyme activity. This is followed on week 5 by a 30% exchange infusion.
![Figure 1. The rats are divided into 3 groups each receives 4 weekly infusion of one of the following samples: lactated ringer’s solution (LR) as control group, bovine polySFHb (Phe) and bovine poly-[Hb-CAT-SOD-CA] (PHE) with enhanced enzyme activity. This is followed on week 5 by a 30% exchange infusion.](/cms/asset/631b072a-5695-41e7-b892-3f5ef92fb8cf/ianb_a_1476375_f0001_c.jpg)
Figure 2. Body weight changes of the rats during the four-week Top-loading infusion period. The body weight is measured in gram (g). Each figure shows a group of rats injected with corresponding sample (control LR, PHe, PHE). The body weight in rats injected with control (LR) are 158 ± 3.7 g, 227 ± 7 g, 288 ± 17 g, 348 ± 20 g. The body weight in rats injected with bovine PHe are 183 ± 9 g, 248 ± 15 g, 313 ± 9 g, 366 ± 25 g. The body weight in rats injected with bovine PHE are 198 ± 4 g, 257 ± 5 g, 318 ± 9 g, 367 ± 9 g. There are no significant differences from the control group.
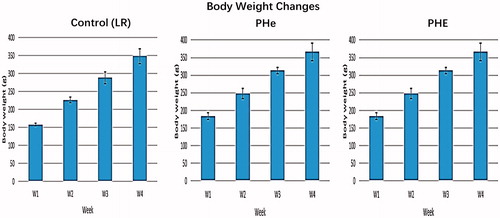
Figure 3. BUN urea, creatinine and CK levels. All data are in . No significant statistical differences from the control groups.
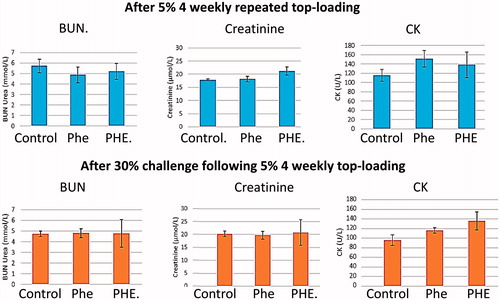
Figure 4. Albumin, total bilirubin, ALT and AST levels. All data are in . No significant statistical differences from the control groups.
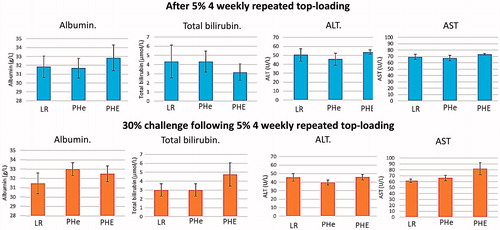
Table 1. Biochemistry test.
Figure 5. Ouchterlony double diffusion test. Positive control of BSA showing BSA and anti-BSA antibody precipitation.
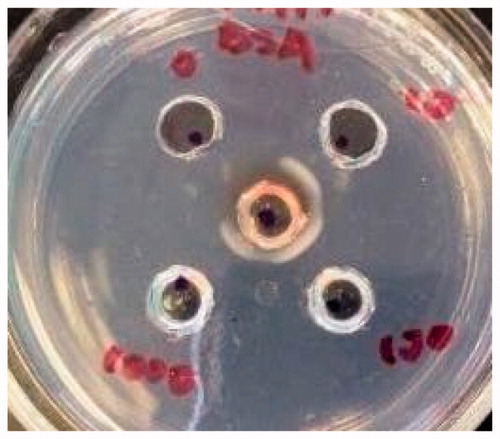
Figure 6. Ouchterlony double diffusion test on rats after 4 weekly 5% top-loading infusion with lactated ringer’s solution as control, Bovine PHe or PHE (6 rats/group) showing no antigen-antibody precipitations.
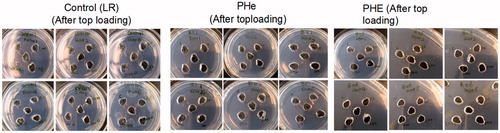
Figure 7. Ouchterlony double diffusion test on rats after 30% blood volume exchange transfusion with control (LR), PHe, or PHE (4 rats/group)) showing no antigen-antibody precipitations.
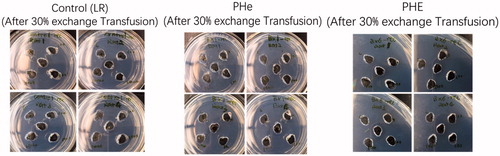
Figure 8. Total IgG levels after four-weekly 5% blood volume top-loading infusions followed by 30% blood volume exchange transfusion. After four-weekly injection-period, the total IgG levels in rat plasma against LR control group, PHe and PHE are 5.42 ± 2.36 mg/ml, 7.88 ± 3.13 mg/ml and 10.41 ± 7.80 mg/ml, respectively; p values by one-way ANOVA is .32 (>.05). After 30% blood volume exchange transfusion, the total IgG concentrations in LR control group, PHe and PHE group are 5.84 ± 1.86 mg/ml, 7.82 ± 3.27 mg/ml and 9.24 ± 5.80 mg/ml; p values by one-way ANOVA is .60 (>.05).
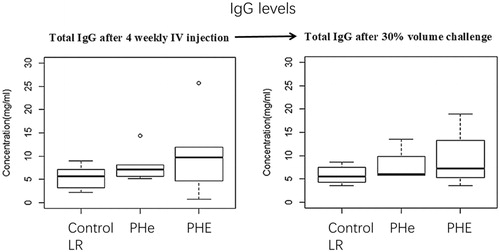
Figure 9. Total IgM levels after four-weekly 5% blood volume top-loading infusions followed by 30% blood volume exchange transfusion. Total IgM levels after top-loading infusion with LR control group, PHe or PHE are 0.56 ± 0.33 mg/ml, 1.24 ± 0.60 mg/ml and 2.28 ± 0.87 mg/ml; p values by one-way ANOVA is .002 (<.05). Total IgM levels after 30% blood volume exchange transfusion with LR control group, PHe or PHE are 0.57 ± 0.22 mg/ml, 1.79 ± 0.75 mg/ml and 2.11 ± 1.33 mg/ml; p values by one-way ANOVA is .14 (>.05). However, if we only compare the control group and PHe group by student’s T-test, the p value is .035 (<.05); compare the control group and PHE by student’s T-test, p value is .093 (>.05).
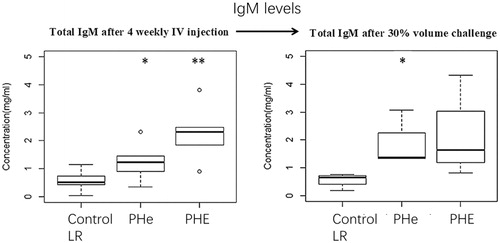
Figure 10. The excess hemoglobin in the poly-[Hb-CAT-SOD-CA] complex nanoencapsulate the more antigenic enzymes.
![Figure 10. The excess hemoglobin in the poly-[Hb-CAT-SOD-CA] complex nanoencapsulate the more antigenic enzymes.](/cms/asset/7e0b9d7c-41d0-4145-8169-120410ea83f2/ianb_a_1476375_f0010_c.jpg)
Figure 11. The antibodies levels against SOD after 4-weekly Top-loading infusions in group of control (LR), PHe and PHE are 1.92 ± 2.09 ng/ml, 1.30 ± 2.11 ng/ml and 1.28 ± 2.57 ng/ml respectively. p Values by one-way ANOVA is .48 (> .05). The antibodies against bovine SOD in group of control (LR), PHe and PHE are 21.13 ± 7.57 ng/ml, 28.79 ± 15.07 ng/ml and 6.80 ± 7.79 ng/ml; p values by one-way ANOVA is .09 (> .05).
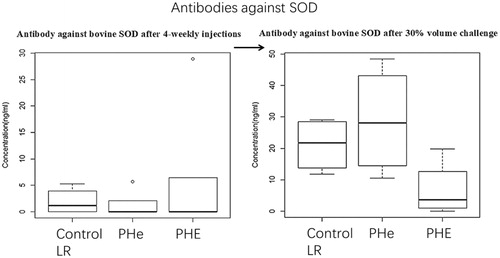
Figure 12. The concentration of antibodies against bovine Hb after four-weekly injection in group of control (LR), PHe and PHE are 0.41 ± 0.09 mg/ml, 0.49 ± 0.13 mg/ml and 0.42 ± 0.08 mg/ml, respectively. The p values by one-way ANOVA is .83 (> .05). After 30% blood volume exchange, the antibodies against Hb in group of control (LR), PHe and PHE are 0.44 ± 0.14 mg/ml, 0.40 ± 0.10 mg/ml and 0.52 ± 0.11 mg/ml, respectively; p values by one-way ANOVA is .47 (> .05).
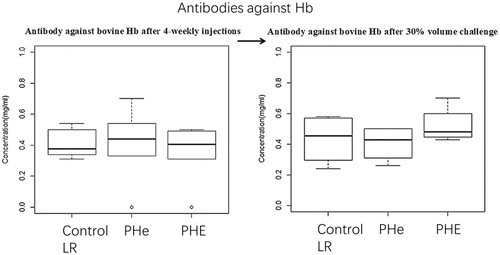
Figure 13. Antibody against bovine CAT after 4-weekly injections followed by 30% blood volume exchange transfusion. No antibody is detected.
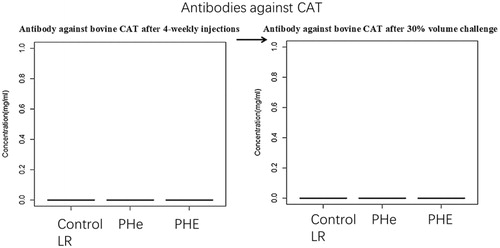
Figure 14. Antibody against bovine CA after four-weekly injections followed by 30% blood volume exchange transfusion. No antibody is detected.
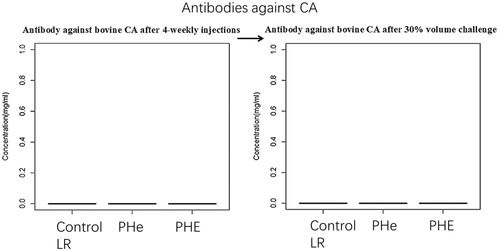
Figure 15. C3a activation test. After four-weekly injections, C3a levels in LR control group, PHe and PHE groups are 144.49 ± 4.39 ng/ml, 150.74 ± 6.38 ng/ml and 153.56 ± 9.90 ng/ml, respectively; p values by one-way ANOVA is .16 (>.05). After four-week top-loading infusions followed by 30% blood volume exchange, C3a levels in LR control group, PHe and PHE groups are 150.74 ± 1.60 ng/ml, 149.70 ± 2.77 ng/ml and 150.50 ± 3.18 ng/ml, respectively; p values by one-way ANOVA is .88 (>.05).
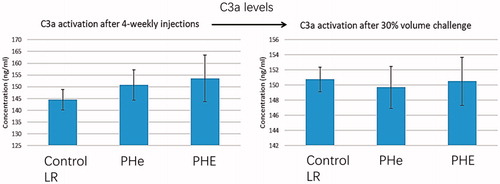
Figure 16. Mean arterial pressures are recorded just before and 5 min after each top-loading infusion. Each figure shows a group of rats injected with corresponding sample. Control (LR): the correlation coefficients between the blood pressure before or after injection are 0. 27 and 0.56, respectively. The p values of the coefficients are 0.73 and 0.44, respectively. PHe: the correlation coefficients between the blood pressure before or after injection are 0.89 and 0.77, respectively. The p values of the coefficients are 0.11 and 0.23, respectively. PHE: the correlation coefficients between the blood pressure before or after injection are 0.16 and 0.30, respectively. The p values of the coefficients are 0.24 and 0.25, respectively.
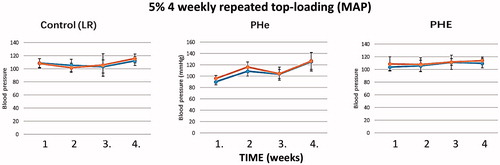
Figure 17. Mean arterial pressure during the 30% blood volume exchange transfusion. Each figure showed a group of rats infused with one of lactated ringer’s solution (control), PHe, PHE. Control (LR): the correlation coefficients of the blood pressure before and after infusion is 0.13. The p values of the coefficient is .55. PHe: the correlation coefficient between the blood pressure before or after infusion is −0.03. The p values of the coefficient is .87. PHE: the correlation coefficients between the blood pressure before or after infusion are −0.16. The p values of the coefficient is .45. Thus, there are no significant changes.
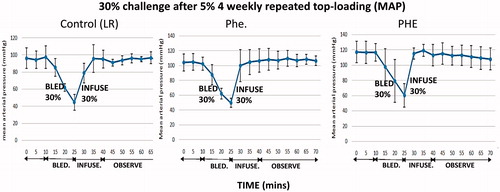
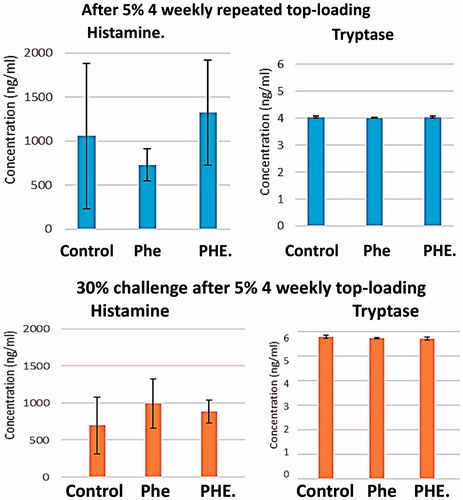
Figure 18. In anaphylactic reaction both histamine and tryptase are released from the mast cells.
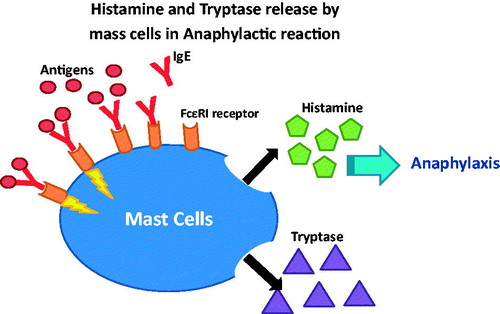
Figure 19. Histamine and tryptase levels tested before and 30 min after 30% blood volume exchange transfusion of LR (control), PHe or PHE. Plasma trptase analysis is more accurate than histamine as shown by the higher SD for histamine. The histamine levels: the p values by one-way ANOVA among the three groups is .62 (>.05). The tryptase levels: comparing the LR control groups and the PHe and PHE groups, the p values by one-way ANOVA is .51 (>.05) before infusion, and the p values of after infusion is .21 (>.05). Thus, there are no significant changes in the histamine or tryptase levels between the control group and the PHe and PHE groups.