
Figures & data
Figure 1. Nanodelivery systems employed for the co-delivery of anticancer therapies.
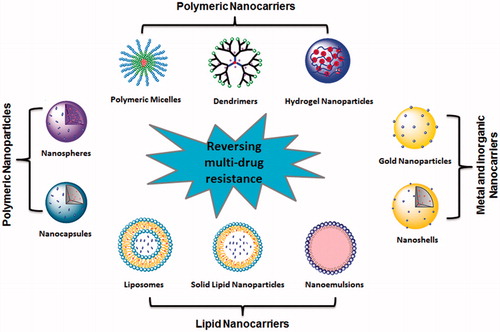
Figure 2. (A) In vivo tumor growth inhibition curves for PBS (▪), oxaliplatin and gem (♦), Zn Control (▲), NCP-1 (▶), NCP-2 (▼), and NCP-3 (◀) on subcutaneous BxPc-3 xenografts. Oxaliplatin (dose, 5 mg/kg) and gem (dose, 50 mg/kg), NCP-1 (doses, 2 mg/kg +0.8 mg/kg), NCP-2 (dose, 2 mg/kg), and NCP-3 (dose, 0.8 mg/kg) were administered on day 0, 4, and 8. Data are expressed as means ± SD (n = 6), *p < .05, **p < .01, ***p < .001. (B) End-point tumor weights. Data are expressed as means ± SD (n = 6), *p < .05, **p < .01, ***p < .001. (C) Photos of the resected BxPc-3 tumors from top to bottom: PBS, oxaliplatin and gem, Zn Control, NCP-2, NCP-3, and NCP-1. (D) In vivo tumor growth inhibition curves for PBS (▪), oxaliplatin and gem (♦), and NCP-1 (▶) on subcutaneous AsPc-1 xenografts. Oxaliplatin (dose, 5 mg/kg) and gem (dose, 50 mg/kg) and NCP-1 (doses, 2 mg/kg +0.8 mg/kg) were administered on day 0, 4, 8, 12, 16, and 20. Data are expressed as means ± SD (n = 6), *p < .05, **p < .01, ***p < .001 [Citation25]. Reprinted with permission from Elsevier B.V (Copyright © 2015) through Copyright Clearance Center.
![Figure 2. (A) In vivo tumor growth inhibition curves for PBS (▪), oxaliplatin and gem (♦), Zn Control (▲), NCP-1 (▶), NCP-2 (▼), and NCP-3 (◀) on subcutaneous BxPc-3 xenografts. Oxaliplatin (dose, 5 mg/kg) and gem (dose, 50 mg/kg), NCP-1 (doses, 2 mg/kg +0.8 mg/kg), NCP-2 (dose, 2 mg/kg), and NCP-3 (dose, 0.8 mg/kg) were administered on day 0, 4, and 8. Data are expressed as means ± SD (n = 6), *p < .05, **p < .01, ***p < .001. (B) End-point tumor weights. Data are expressed as means ± SD (n = 6), *p < .05, **p < .01, ***p < .001. (C) Photos of the resected BxPc-3 tumors from top to bottom: PBS, oxaliplatin and gem, Zn Control, NCP-2, NCP-3, and NCP-1. (D) In vivo tumor growth inhibition curves for PBS (▪), oxaliplatin and gem (♦), and NCP-1 (▶) on subcutaneous AsPc-1 xenografts. Oxaliplatin (dose, 5 mg/kg) and gem (dose, 50 mg/kg) and NCP-1 (doses, 2 mg/kg +0.8 mg/kg) were administered on day 0, 4, 8, 12, 16, and 20. Data are expressed as means ± SD (n = 6), *p < .05, **p < .01, ***p < .001 [Citation25]. Reprinted with permission from Elsevier B.V (Copyright © 2015) through Copyright Clearance Center.](/cms/asset/223f1a88-acd4-44fb-aba1-403b0caa136d/ianb_a_1478420_f0002_c.jpg)
Figure 3. In vivo bio-distribution and anti-tumor efficacy of nanocarriers in tumor-bearing mice. (A) Near-IR optical imaging of A549 tumor-bearing nude mice at 4, 24, 48 and 72 h after intravenous injection of MB-20/Cy5.5 at Cy5.5 dose of 26 nmol/kg. The red arrow in the light phase indicated the tumor site. (B) Ex vivo imaging of tumors and other tissues of A549 tumor-bearing nude mice at 72 h post injection. (C) The quantitative analysis of fluorescence signals from tumors and other tissues. Values are means ± SD (n = 3). *p < .05 with respect to heart, spleen and kidney groups. (D) The A549 tumor growth curves after treating with either PBS, CPT, DOX, MB-20 nanocarrier or MB-20/Dox nanocarrier. Values are means ± SEM (n = 5). *p < .05 compared to PBS, CPT and Dox groups; +p < .05 compared to MB-20. (E) The body weight variation of mice after treated with different formulations [Citation33]. Reprinted with permission from Elsevier Ltd. (Copyright © 2014) through Copyright Clearance Center.
![Figure 3. In vivo bio-distribution and anti-tumor efficacy of nanocarriers in tumor-bearing mice. (A) Near-IR optical imaging of A549 tumor-bearing nude mice at 4, 24, 48 and 72 h after intravenous injection of MB-20/Cy5.5 at Cy5.5 dose of 26 nmol/kg. The red arrow in the light phase indicated the tumor site. (B) Ex vivo imaging of tumors and other tissues of A549 tumor-bearing nude mice at 72 h post injection. (C) The quantitative analysis of fluorescence signals from tumors and other tissues. Values are means ± SD (n = 3). *p < .05 with respect to heart, spleen and kidney groups. (D) The A549 tumor growth curves after treating with either PBS, CPT, DOX, MB-20 nanocarrier or MB-20/Dox nanocarrier. Values are means ± SEM (n = 5). *p < .05 compared to PBS, CPT and Dox groups; +p < .05 compared to MB-20. (E) The body weight variation of mice after treated with different formulations [Citation33]. Reprinted with permission from Elsevier Ltd. (Copyright © 2014) through Copyright Clearance Center.](/cms/asset/ce3337ca-d6f4-4f68-a1b8-e4492f3c30b8/ianb_a_1478420_f0003_c.jpg)
Figure 4: Antitumor activity in vivo against MDA-MB-231 tumor. (A). MDA-MB-231 tumor growth in mice treated with saline, free DOX, liposomal DOX, NP3, and NP3-plus-NIR laser irradiation. Arrows indicate dates of injection of each dose of 15 mg equivalent DOX/kg. In the free DOX group, the mice were injected only once on day 0. In the NP3-plus-laser group, tumor irradiation (1.5 W/cm2 for 5 min) was commenced 24 h after nanoparticles injection. (B). Photographs of MDA-MB-231 tumors after treatment with NP3-plus-laser. (C). Percentage of mean body weight change. For (A) and (C), the data are presented as mean ± standard deviation (n = 5–7) [Citation44]. Reprinted with permission from Elsevier B.V. (Copyright © 2011) through Copyright Clearance Center.
![Figure 4: Antitumor activity in vivo against MDA-MB-231 tumor. (A). MDA-MB-231 tumor growth in mice treated with saline, free DOX, liposomal DOX, NP3, and NP3-plus-NIR laser irradiation. Arrows indicate dates of injection of each dose of 15 mg equivalent DOX/kg. In the free DOX group, the mice were injected only once on day 0. In the NP3-plus-laser group, tumor irradiation (1.5 W/cm2 for 5 min) was commenced 24 h after nanoparticles injection. (B). Photographs of MDA-MB-231 tumors after treatment with NP3-plus-laser. (C). Percentage of mean body weight change. For (A) and (C), the data are presented as mean ± standard deviation (n = 5–7) [Citation44]. Reprinted with permission from Elsevier B.V. (Copyright © 2011) through Copyright Clearance Center.](/cms/asset/4044582f-e027-43cd-97fe-cf6aab70bd73/ianb_a_1478420_f0004_c.jpg)