Figures & data
Figure 1. Ex vivo fluorescence of Doxorubicin in organs collected from mice treated with free doxorubicin (DOX) or with nanocapsules containing selol and doxorubicin (NCS-DOX) at 2, 4 and 8 h post-administration. Each panel above shows the organs of one representative animal out of three studied for each time and treatment.
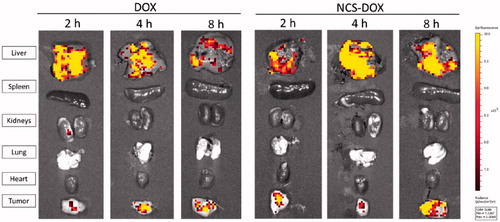
Figure 2. Graphs presents the quantitative evaluation the DOX-specific fluorescence photon counts of DOX (free doxorubicin) and nanocapsules containing selol and doxorubicin (NCS-DOX), as photons per second per gram of tissue (p/s/g). Data are expressed as mean ± standard error of the mean for three animals.
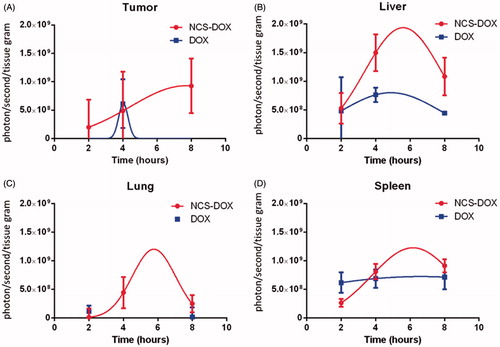
Figure 3. Graphs represents the area under the curve of the data plotted in . Data are expressed as mean ± standard error of the mean for three animals.
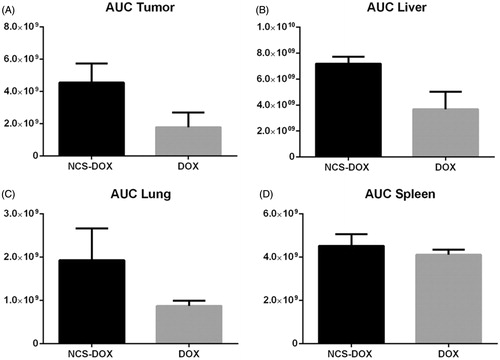
Figure 4. Graphs represents evolution of 4T1 tumours volume in mice treated with free doxorubicin (DOX), nanocapsules containing selol and doxorubicin (NCS-DOX), nanocapsules of selol (NCS) and control group (vehicle only, which consisted of an aqueous solution of glucose 5% w:v). Treatments were performed at days 0, 3, 6 and 9 (arrows). Data are expressed as mean ± standard error of the mean. n = 6 mice per group. a=p < .05 versus all other treatments.
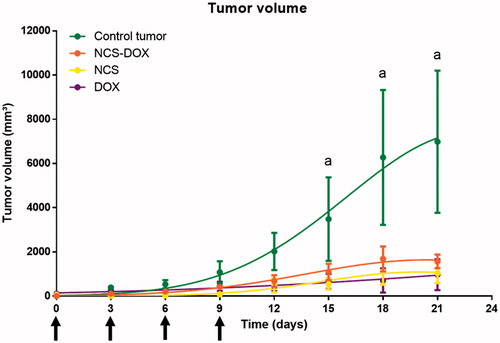
Figure 5. Graphs represent weight alteration in mice treated with free doxorubicin (DOX), nanocapsules containing selol and doxorubicin (NCS-DOX), nanocapsules of selol (NCS), control group with and without tumour (vehicle only, which consisted of an aqueous solution of glucose 5% w:v).during the experiments. Data are expressed as mean ± standard error of the mean. n = 6 mice per group. a = p < .05 versus all other treatments.
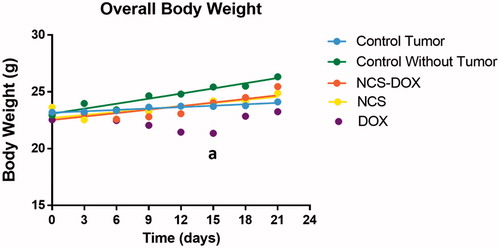
Figure 6. Graphs represent creatine kinase MB (CK-MB) activity in the serum of mice treated with doxorubicin alone (DOX), nanocapsules containing selol and doxorubicin (NCS-DOX), nanocapsules of selol (NCS), and control mice, with and without tumour (vehicle only, which consisted of an aqueous solution of glucose 5% w:v). Data are expressed as mean ± standard error of the mean. a = p < .05 when compared to the other groups, except NCS.
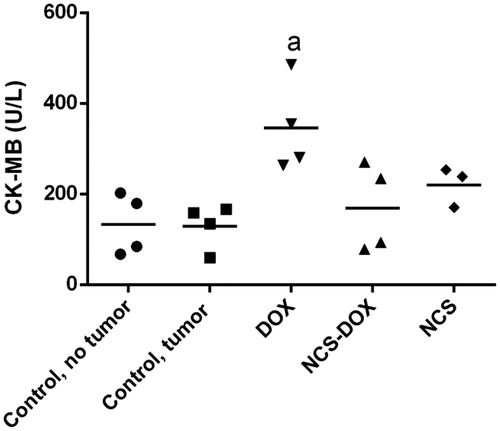
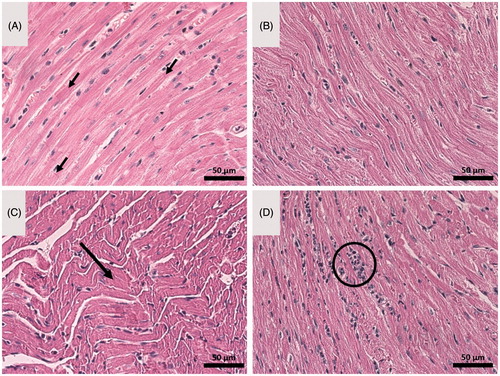
Figure 7. Optical microscopy images of heart tissue of: (A) control tumour-bearing mice (received vehicle only, which consisted of an aqueous solution of glucose 5% w:v), (B) mice treated with nanocapsules of selol (NCS), (C) mice treated with doxorubicin alone (DOX), and (D) mice treated with nanocapsules containing selol and doxorubicin (NCS-DOX). Arrows in A indicate parallel muscle fibers and the perpendicular intercalated discs. The arrow in C indicates wavy muscle fibers. The circle in D shows inflammatory infiltrate. Classical staining with hematoxylin and eosin was used.