Figures & data
Figure 1. The schematic representation for the synthesis of sk-AuNPs and cf-sk-AuNPs.
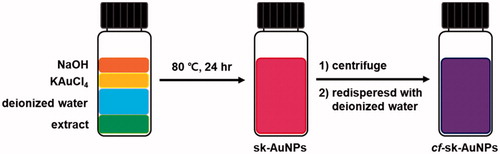
Table 1. Amino acid composition analysis of the extract.
Figure 2. UV–visible spectra of sk-AuNPs.
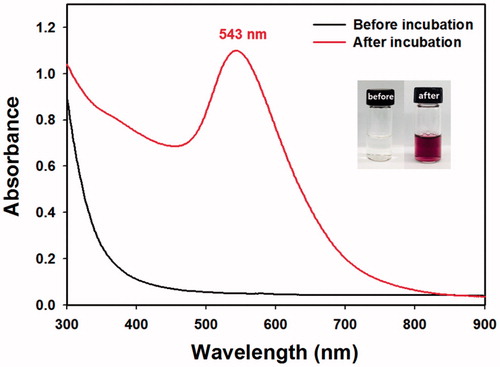
Figure 3. HR-XRD pattern of cf-sk-AuNPs.
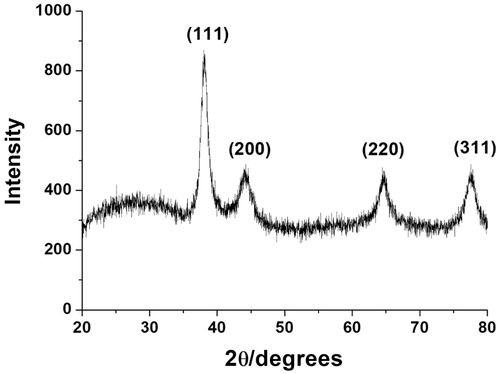
Figure 4. HR-TEM images of sk-AuNPs. The scale bars represent (A) 20 nm, (B) 50 nm and (C) 2 nm. The distances between two neighbouring lattice fringes were measured as 0.23 nm and 0.25 nm. (D) Size histogram of sk-AuNPs.
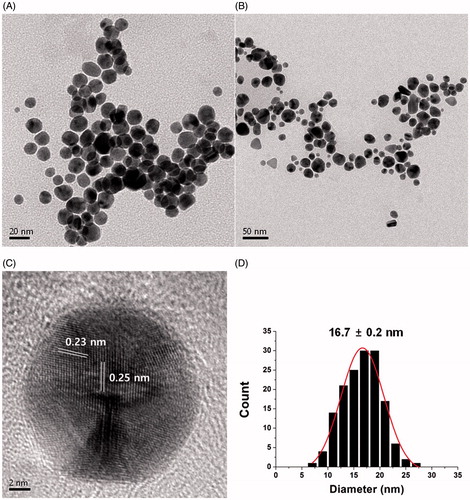
Figure 5. HR-TEM images and size histogram of cf-sk-AuNPs. After the centrifugation of sk-AuNPs, the pellet was recovered and re-dispersed in (A, B and C) deionised water, (D, E and F) PBS and (G, H and I) full media.
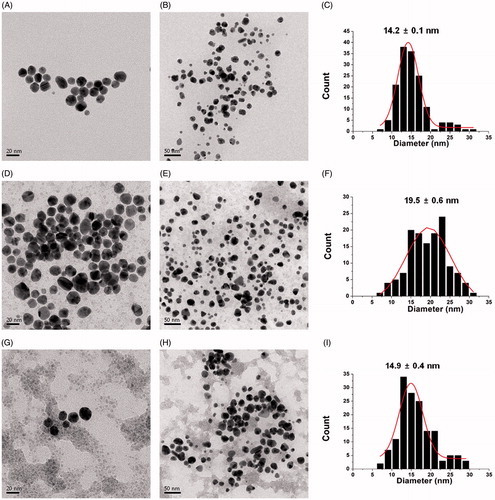
Table 2. On-the-shelf colloidal stability of cf-sk-AuNPs for 27 days.
Figure 6. Colloidal stability of sk-AuNPs in PBS, DMEM and full media. sk-AuNPs were centrifuged and re-dispersed in the following solutions: (A and B) PBS, (C and D) DMEM and (E and F) full media. (A, C and E) UV–visible spectra and (B, D and F) hydrodynamic size were measured over 48 h on the shelf.
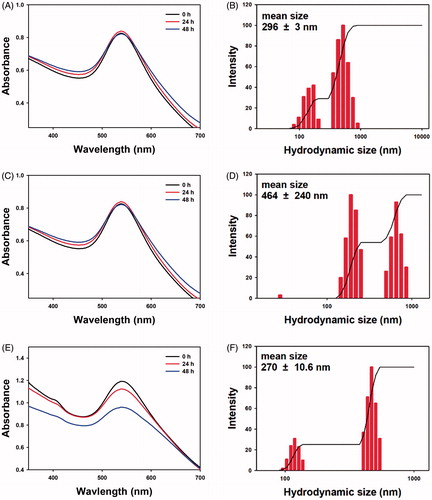
Table 3. Colloidal stability of sk-AuNPs which were centrifuged and re-dispersed in PBS, DMEM and full media.
Figure 7. In vitro antioxidant activity (DPPH radical scavenging activity) of cf-sk-AuNPs.
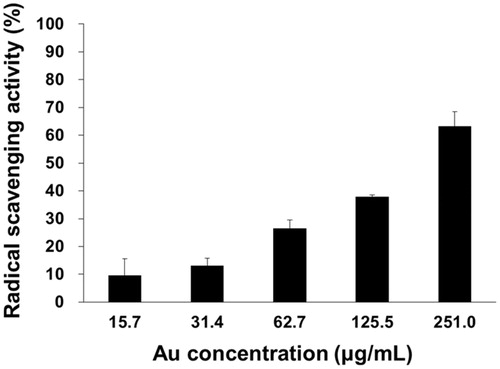
Table 4. DPPH radical scavenging activity of cf-sk-AuNPs.
Figure 8. Cytotoxicity of cf-sk-AuNPs on seven cancer cells. (A) A549, (B) AGS, (C) HeLa, (D) HepG2, (E) HT29, (F) MDA-MB-231 and (G) PANC-1.
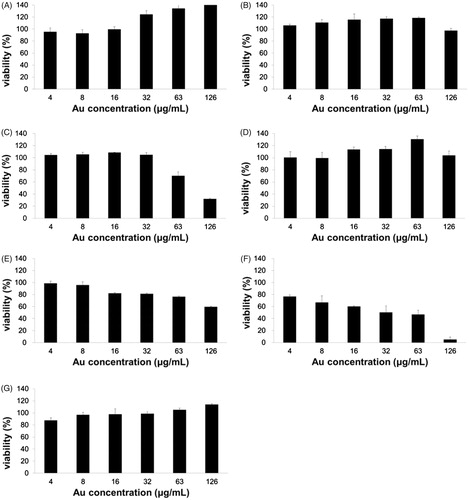
Figure 9. Cell morphology of HeLa cells with different concentrations of Au. (A) 0 μg/mL, (B) 16 μg/mL, (C) 32 μg/mL, (D) 63 μg/mL and (E)126 μg/mL.
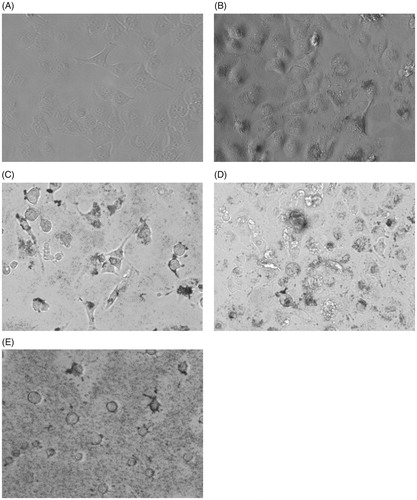
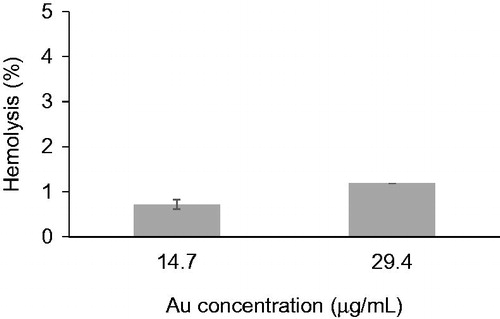
Figure 10. Haemocompatibility assay.