Figures & data
Figure 1. miR-1297 is down-regulated in cancer tumours than non-tumour tissues. qRT-PCR was used to determine the expression level of miR-1297 in human cervical carcinoma tissues. Data represent the mean ± SE, *p < .05, versus non-cancerous-tissues.
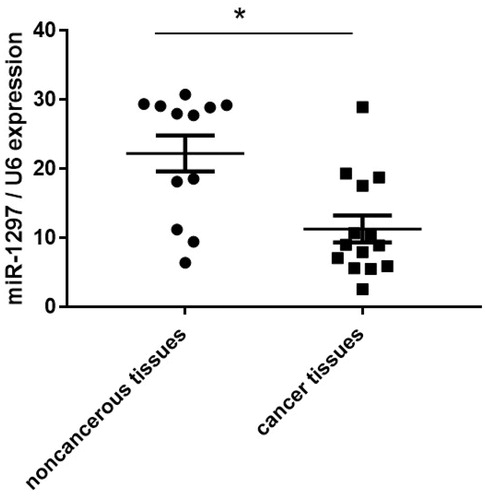
Figure 2. Effects of miR-1297 on HeLa cell proliferation. HeLa cells were transfected with lentiviral vector control (lenti-NC) and miR-1297. (A) The expression level of miR-1297 in HeLa cells after miR-1297 overexpression; (B) CCK-8 cell proliferation assay was used to monitor the cell proliferation of HeLa cells or HeLa cells expressing either Lenti-NC or miR-1297; (C) Representative colony formation assays of HeLa cells expressing either Lenti-NC or miR-1297. Data represent the mean ± SE (n = 3). *p < .05, versus WT; **p < .05, versus Lenti-NC. (D) Effect of has-miR-1297 overexpression on HeLa cell apoptosis as measured by Annexin V flow cytometry. The cell viability was presented as mean ± SE (n = 3). *p < .05 versus WT; (E) mRNA expression analysis of pro-apoptotic (Bad and Bax) or anti-apoptotic (Bcl-2 and Mcl1) factors by taqman qRT-PCR in the HeLa cells with or without has-miR-1297 overexpression. β-Actin was used as an internal control. The results were presented as mean ± SE (n = 3). *p < .05 versus WT.
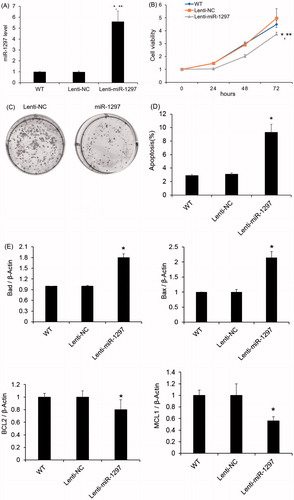
Figure 3. PTEN expression is negatively correlated with miR-1297 (A) PTEN mRNA expression level was determined by qRT-PCR in human cervical carcinoma tissues. Data represents the mean ± SE, *p < .05, versus noncancerous-tumour tissues; (B) PTEN is validated as the direct target of miR-1297 by 3’ UTR luciferase assay; (C) PTEN mRNA expression with HeLa cells after overexpression of miR-NC or miR-1297. Results are mean ± SE. *p < .05 versus WT; **p < .05 versus miR-Ctrl; (C) PTEN protein level was determined by western blotting. β-actin was used as an internal control.
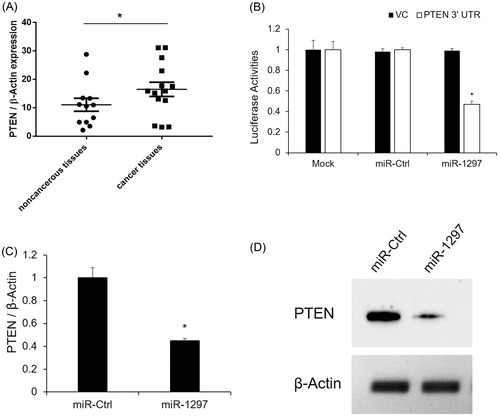
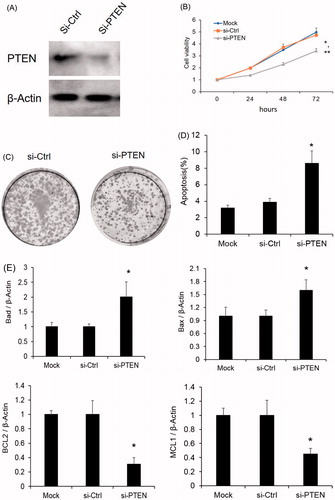
Figure 4. PTEN silencing effects the HeLa cell proliferation (A) PTEN protein expression level was determined by western blotting after PTEN knock-down. β-actin was used as an internal control. (B) Cell proliferation was monitored by CCK8 assay after PTEN silencing. *p < .05 versus Mock; **p < .05 versus si-Ctrl; (C) PTEN mRNA expression with HeLa cells after overexpression of miR-NC or miR-1297. Results are mean ± SE. *p < .05 versus WT; **p < .05 versus miR-Ctrl; (C) Representative colony formation assays of HeLa cells expressing either si-Ctrl or si-PTEN. (D) Effect of PTEN silencing on HeLa cell apoptosis as measured by Annexin V flow cytometry. The cell viability was presented as mean ± SE (n = 3). *p < .05 versus WT; (E) mRNA expression analysis of pro-apoptotic (Bad and Bax) or anti-apoptotic (Bcl-2 and Mcl1) factors by taqman qRT-PCR in the HeLa cells with or without PTEN silencing. β-Actin was used as an internal control. The results were presented as mean ± SE (n = 3). *p < .05 versus WT.