
Figures & data
Figure 1. Characterization of targeting molecular materials. (A) MALDI-TOF-MS spectrum of DSPE-PEG2000-NHS, (B) MALDI-TOF-MS spectrum of DSPE-PEG2000-DQA.
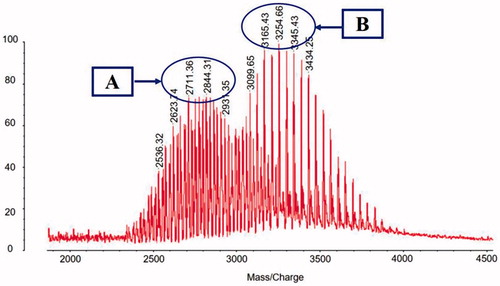
Figure 2. Characterization of DQA modified paclitaxel plus honokiol micelles and release rate of paclitaxel and honokiol in PBS solution containing 10% mouse plasma. (A) A schematic representative of DQA modified paclitaxel plus honokiol micelles, (B) TEM image of DQA modified paclitaxel plus honokiol micelles, agnification × 50,000, (C) Partical size of DQA modified paclitaxel plus honokiol micelles, (D) Release rate of paclitaxel from the varying formulations, € Release rate of honokiol from the varying formulations. Data are presented as mean ± SD (n = 3).
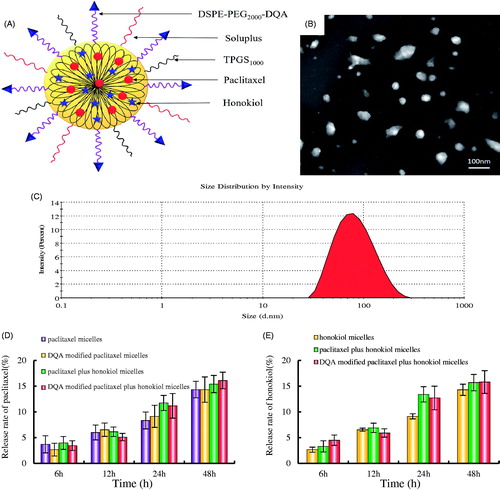
Table 1. Characterization of micelles.
Figure 3. Inhibitory effects on LLT cells after treatments with the varying formulations. (A) Inhibitory effects of free drugs, a, vs. free honokiol; b, vs. free paclitaxel; c, vs. free paclitaxel : free honokiol = 1 : 0.5; d, vs. free paclitaxel : free honokiol = 1 : 1; e, vs. free paclitaxel : free honokiol = 1 : 3. I, vs. a; II, vs. b; III, vs. c; IV, vs. d. (B) Inhibitory effects of micellar formulations. a, vs. blank micelles; b, vs. paclitaxel micelles; c, vs. DQA modified paclitaxel micelles; d, vs. paclitaxel plus honokiol micelles; e, vs. DQA modified paclitaxel plus honokiol micelles. 1, vs. a; 2, vs. b; 3, vs. c; 4, vs. d. Data are presented as mean ± SD (n = 3). p < .05.
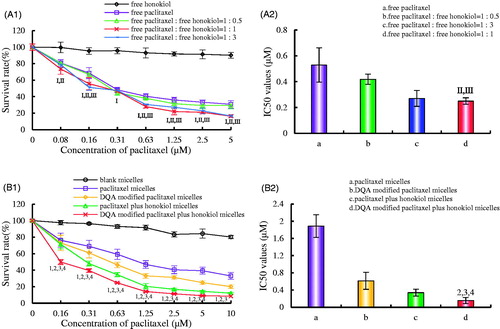
Figure 4. Cellular uptake and targeting effects after incubation with the varying formulations. (A) Cellular uptake of LLT cells, (B) Fluorescence intensity of coumarin 6 in LLT cells, (C) Fluorescence microscopy images of LLT cells incubated with the varying formulations, magnification × 250. a. blank micelles; b. coumarin micelles; c. coumarin plus honokiol micelles; d. DQA modified coumarin micelles; e. DQA modified coumarin plus honokiol micelles. p < .05, 1, vs. a; 2, vs. b; 3, vs. c.
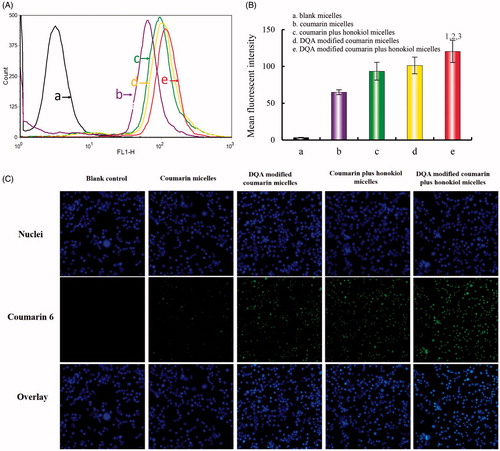
Figure 5. Destructive effects on VM channels after treatments with the varying formulations. a. blank micelles; b. paclitaxel micelles; c. DQA modified paclitaxel micelles; d. paclitaxel plus honokiol micelles; e. DQA modified paclitaxel plus honokiol micelles.
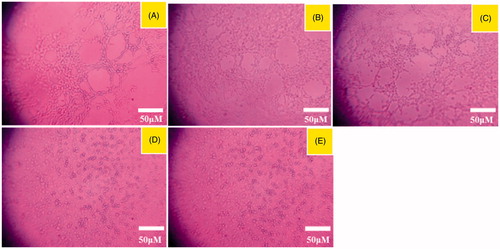
Figure 6. Blocking effects on LLT cells migration and blocking wound healing effects in vitro after treatments with the varying micellar formulations. (A) Blocking effects on LLT cells migration, (B) Blocking wound healing effects, C. Inhibition ratio of wound healing. a. paclitaxel micelles; b. DQA modified paclitaxel micelles; c. paclitaxel plus honokiol micelles; d. DQA modified paclitaxel plus honokiol micelles. p < .05, 1, vs. a; 2, vs. b; 3, vs. c.
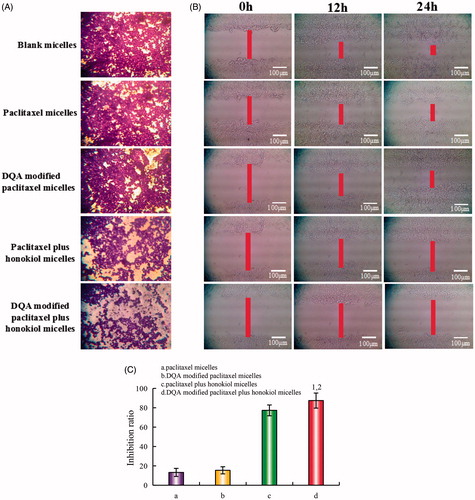
Figure 7. Adhesion rate of LLT cells on Matrigel after incubation with the varying formulations. (A) Cellular survival rate of LLT cells after incubation with drug for 12h, (B) Adhesion rate of LLT cells on Matrigel. a. blank micelles; b. paclitaxel micelles; c. DQA modified paclitaxel micelles; d. paclitaxel plus honokiol micelles; e. DQA modified paclitaxel plus honokiol micelles. p < .05, 1, vs. a; 2, vs. b; 3, vs. C; 4, vs. d.
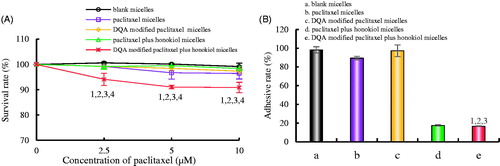
Figure 8. Apoptosis inducing effects on LLT cells after incubation with the varying formulations. (A) Plots by flow cytometry of apoptosis-inducing effects in LLT cells, (B) Apoptosis- inducting effects after treatments with the varying formulations. Data are presented as the mean ± SD (n = 3). a. blank micelles; b. paclitaxel micelless; c. DQA modified paclitaxel micelles; d. paclitaxel plus honokiol micelles; e. DQA modified paclitaxel plus honokiol micelles. p < .05, 1, vs. a; 2, vs. b; 3, vs. C; 4, vs. d.
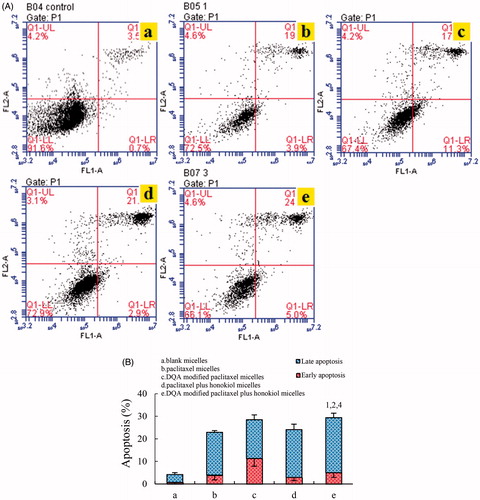
Figure 9. Regulating effects on metastasis related proteins and apoptotic enzyme in LLT cells after treatments with the varying formulations. a. blank micelles; b. paclitaxel micelless; c. DQA modified paclitaxel micelles; d. paclitaxel plus honokiol micelles; e. DQA modified paclitaxel plus honokiol micelles. p < .05, 1, vs. a; 2, vs. b; 3, vs. C; 4, vs. d. Data are presented as mean ± SD (n = 4).
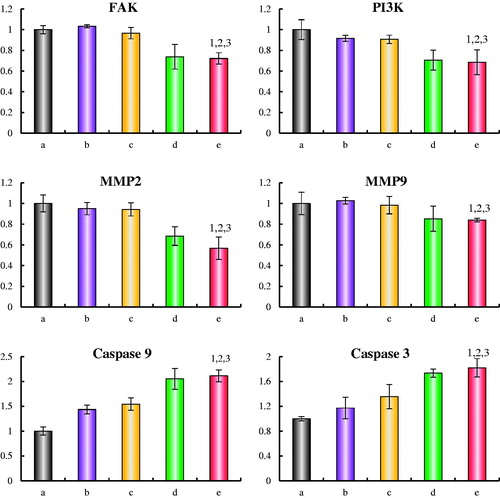
Figure 10. In vivo real-time imaging observation after intravenous administration of the varying formulations.
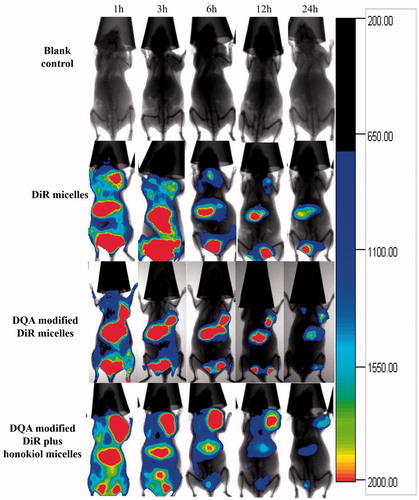
Figure 11. Antitumor effects in LLT cells xenografts mice after treatments with the varying formulations. (A) Body weight changes, (B) Tumour volume, (C) Tumour volume changes, D. Survival rates. 1. blank control; 2. free paclitaxel.
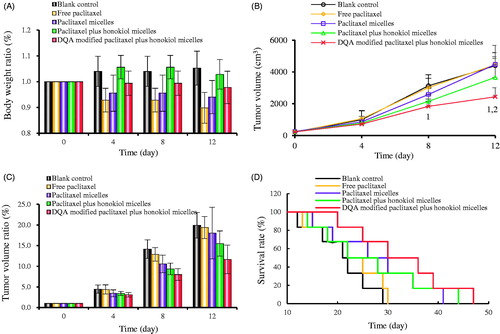
Table 2. Haematology parameters assay results from tumour-bearing mice.