Figures & data
Figure 1. CysLTR-1 but not cysLTR-2 is expressed in BMM cells. Human SH-SY5Y cells were used as a positive control. (A) Gene expression of cysLTR-1 could be detected in BMMs; (B) Protein expression of cysLTR-1 could be detected in BMMs; (C) Gene expression of cysLTR-2 could not be detected in BMMs; (D) Protein expression of cysLTR-2 could not be detected in BMM cells.
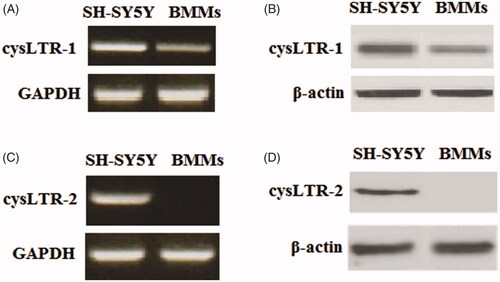
Figure 2. CysLTR-1 expression was increased during the process of osteoclast differentiation. BMMs were cultured with 50 ng/ml RANKL and 20 ng/ml M-CSF for 1, 3, or 6 days. (A) Expression of NFATc1 and TRAP; (B) CysLTR-1 was significantly upregulated in response to RANKL and M-CSF treatment at the mRNA level; (C) Western blot analysis revealed that cysLTR-1 was significantly upregulated in response to RANKL and M-CSF treatment at the protein level (*, p < .01 vs. vehicle group).
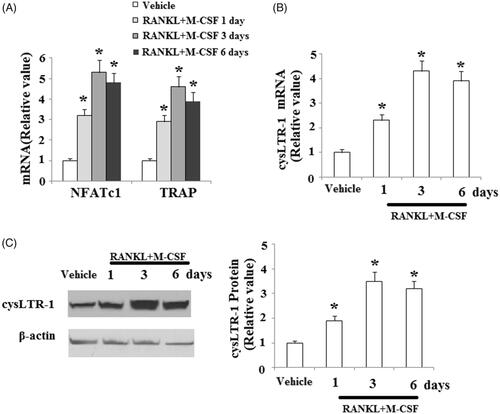
Figure 3. Overexpression of cysLTR-1 promoted osteoclast differentiation. (A) Successful overexpression of cysLTR-1 is shown in Figure 1(A); (B) Overexpression of cysLTR-1 markedly increased NFATc1 and TRAP at the mRNA level; (C) Overexpression of cysLTR-1 markedly increased NFATc1 and TRAP at the protein level (*, #, p < .01 vs. previous column group).
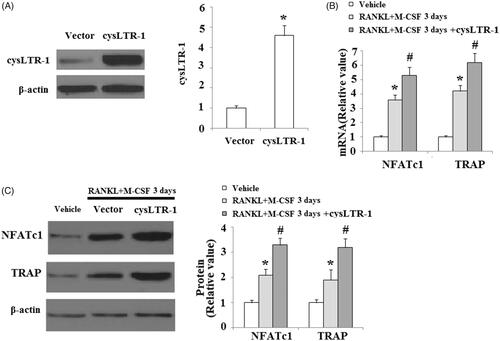
Figure 4. The cysLTR-1 specific inhibitor montelukast inhibited osteoclastogenesis of BMMs. (A) Montelukast prevented the RANKL- and M-CSF-induced increase in the expression of NFATc1 and TRAP at the mRNA level in BMMs; (B) Montelukast prevented the RANKL- and M-CSF-induced increase in the expression of NFATc1 and TRAP at the protein level in BMMs (*, #, p < .01 vs. previous column group).
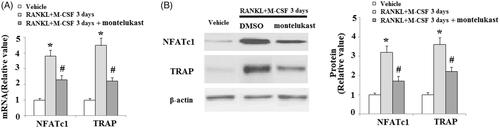
Figure 5. Effects of montelukast on the osteoclastogenesis-related signalling pathway. Mouse BMMs were incubated in serum-free medium for 5 h and pretreated with vehicle or montelukast (10 µM) for 2 h. Cells were treated with RANKL (50 ng/ml) and M-CSF (20 ng/ml) for 30 min. (A). Phosphorylation of MAPK family members EKR, JNK and p38; (B). Phosphorylation of AKT; (C). Phosphorylation of IκBα and p65 (*, #, p < .01 vs. previous column group).
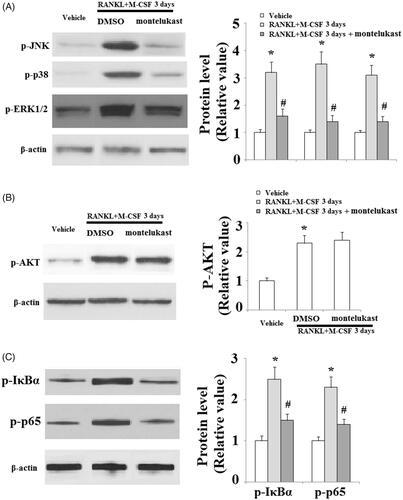
Figure 6. Effects of montelukast on the generation of osteoclastogenesis-related reactive oxygen species (ROS) and calcium signalling activation. Mouse BMMs were incubated in serum-free medium for 5 h and pretreated with vehicle or montelukast (10 µM) for 2 h, followed by incubation with 50 ng/ml RANKL and 20 ng/ml M-CSF for 30 min. (A) Representative images for DCF fluorescence; (B) Phosphorylation of PLCγ2 (*, #, p < .01 vs. previous column group).
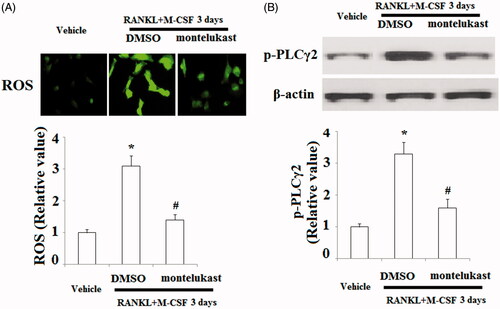
Figure 7. Montelukast inhibited interaction between TRAF6 and RANK. Mouse BMMs were incubated in serum-free medium for 5 h and pretreated with vehicle or montelukast (10 µM) for 2 h, followed by incubation with 50 ng/ml RANKL and 20 ng/ml M-CSF for 6 h. Representative images for co-immunoprecipitation of TRAF6 and RANK (*, #, p < .01 vs. previous column group).
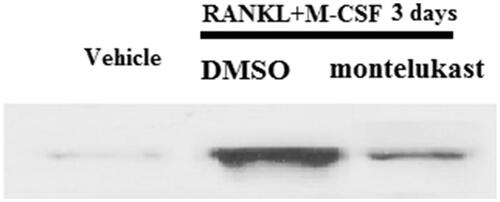
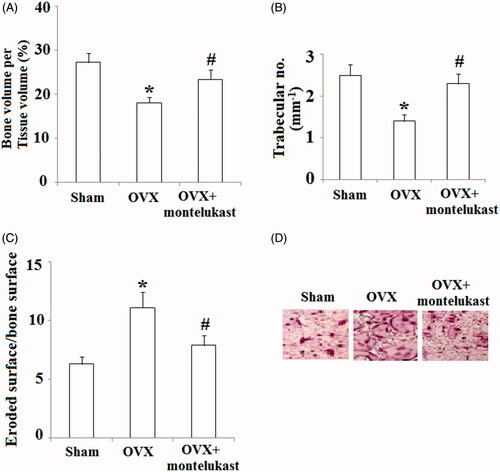
Figure 8. Montelukast ameliorated ovariectomy-induced bone loss by suppressing osteoclast activity. Ovariectomized mice were intraperitoneally injected with montelukast or vehicle control (2 days each time for 4 weeks). (A) Bone volume/tissue volume was analyzed; (B) Bone trabecular number was analyzed; (C) Eroded surface/bone surface was analyzed; (D) TRAP staining of the proximal tibiae of Sham, OVX and montelukast-treated OVX mice (*, #, p < .01 vs. previous column group).