Figures & data
Figure 1. The nucleotide sequence of ssArd1.
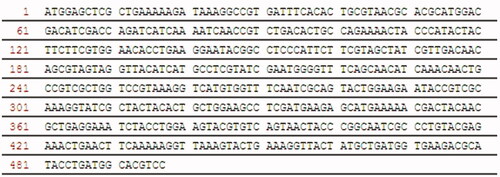
Figure 2. The one-step chromosomal integration strategy of ssArd1.
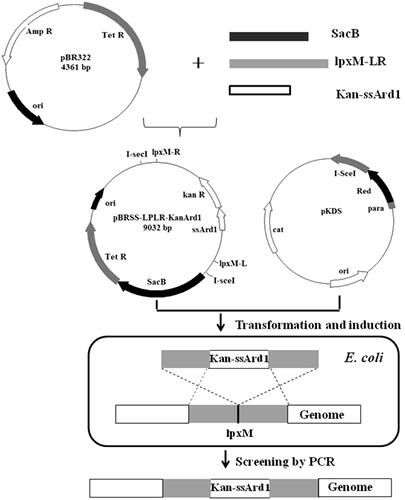
Figure 3. The nucleotide (A) and protein sequence (B) of rhTβ4-Intein.
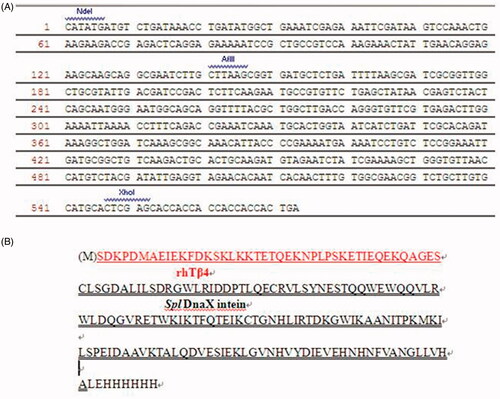
Figure 4. Expression and purification of N-acetylated rhTβ4. (A) SDS-PAGE analysis of the expression of rhTβ4-Intein fusion protein in three batches of 30L fermentation broth in E. coli. (B) SDS-PAGE analysis of the purified rhTβ4 from three batches fermentation. Lane M: low molecular protein Marker; Lane A1–3: ultrasonic supernatant s of three batches; Lane B1–3: purified rhTβ4 of three batches.
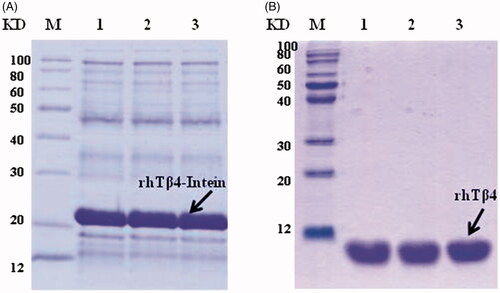
Figure 5. The accurate molecular mass, whole sequence and N-acetylation of rhTβ4 detected by Mass Spectrometer. (A) High resolution precise molecular weight (after deconvolution); (B) Mascot search result of the whole sequence and the coverage was 100%; (C) Mascot search result of the 1–22 Aa of rhTβ4 showed the N-terminal was fully acetylated.
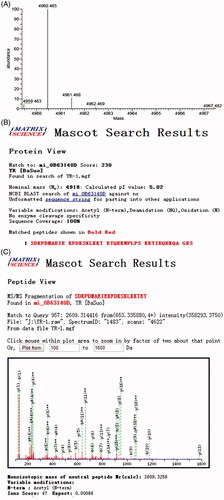
Figure 6. Purity of sTβ4 and rhTβ4 from different batches detected by SEC-HPLC.
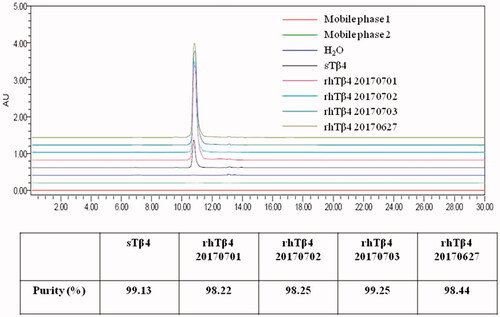
Figure 7. Stability analysis of the of rhTβ4 by SDS-PAGE. (A) rhTβ4 kept at different temperature on month 0; (B): rhTβ4 kept at different temperature on month 12;: rhTβ4 kept at different temperature on month 24. Lane M, low molecule protein marker; Lane 1, 2 ∼ 8 °C; Lane 2, –20 °C; Lane 3, –80 °C.
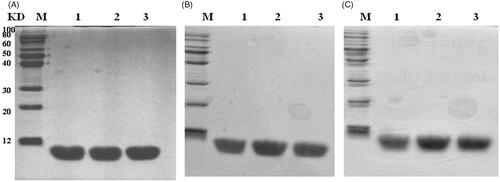
Figure 8. Binding activity of sTβ4 and rhTβ4 with actin from human platelet (A) and bovine cardiac muscle (B).
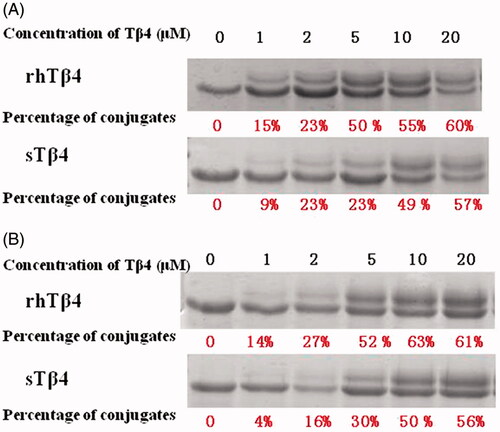
Figure 9. Tear volume evaluated by Schirmer I test (SIt) (A) and tear film break up time (BUT) (B).
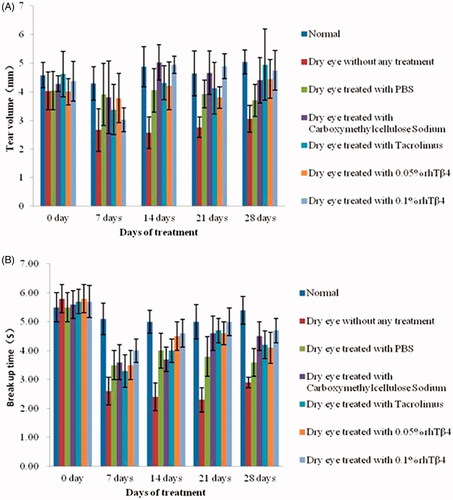
Figure 10. Corneal fluorescein staining (A) and scores (B). a: Normal group without any treatment; b: Dry eyes group without any treatment; c: Dry eyes group treated with PBS; d: Dry eyes group treated with Carboxymethylcellulose Sodium Eye Drops; e: Dry eyes group treated with Tacrolimus Eye Drops; f: Dry eyes group treated with 0.05% rhTβ4; g: Dry eyes group treated with 0.1% rhTβ4.
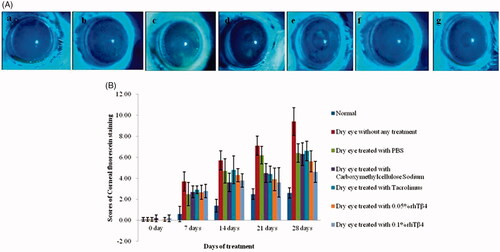
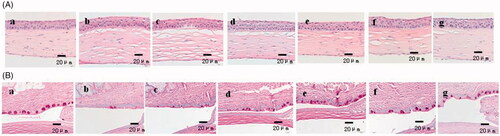
Figure 11. Haematoxylin-eosin (HE) staining (A) and periodic acid schiff (PAS) (B) staining of corneal tissue sections. a: Normal group without any treatment; b: Dry eyes group without any treatment; c: Dry eyes group treated with PBS; d: Dry eyes group treated with Carboxymethylcellulose Sodium Eye Drops; e: Dry eyes group treated with Tacrolimus Eye Drops; f: Dry eyes group treated with 0.05% rhTβ4; g: Dry eyes group treated with 0.1% rhTβ4.