Figures & data
Figure 1. Generation of NK-EM. (A) Schematic illustration of the procedure for the generation of NK-Exo and NK-EM. (B) Western blot analysis of exosomal marker proteins on NK-Exo and NK-EM (50 μg total protein). The yields of NK-Exo and NK-EM measured as the total protein (C) and particle number (D) from 5 × 10⁶ NK cells. Experiments were performed in triplicate and mean ± SD values are plotted; ***p < .001.
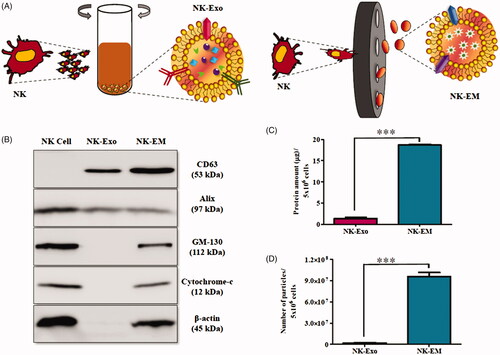
Figure 2. Characterization of NK-Exo and NK-EM. (A) Representative transmission electron micrograph of NK-Exo and NK-EM (scale bars denote 200 and 100 nm, respectively). (B) Size distributions of NK-Exo and NK-EM were measured by nanoparticle tracking analysis.
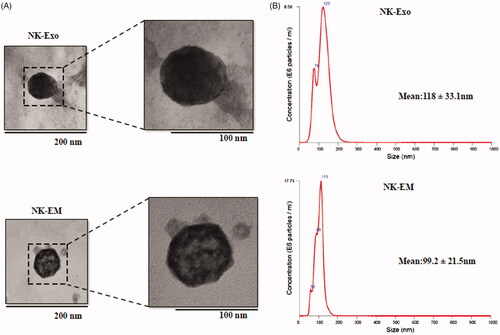
Figure 3. In vitro cytotoxicity of NK-Exo against glioblastoma cells. (A) Concentration- and time-dependent cytotoxic effects of NK-EM and NK-Exo on D54/F cells. (B, C and D) Intensity of bioluminescence was quantified using an in vivo imaging system and live imaging software. Experiments were performed at least in triplicate and mean ± SD values are plotted; *p < .05, **p < .01, ***p < .001; ## p < .01, ### p < .001.
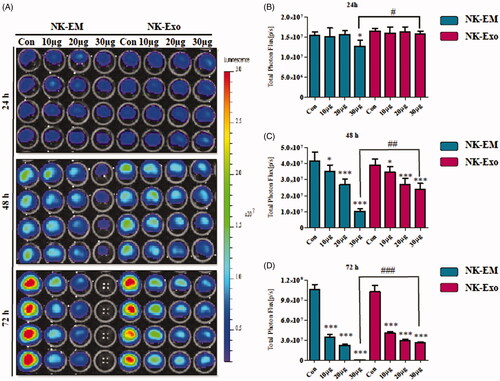
Figure 4. In vivo targeting of DiD-labelled NK-EM to tumours in mice. D54/F cells were injected subcutaneously into BALB/c nude mice. Four weeks later, the mice each received an intravenous injection of DiD-labelled NK-EM (100 μg total protein) or PBS. Normal mice without tumours were used as the control. After 24 h, the DiD fluorescence of the whole mouse body (A) or various tissues (B) was revealed in an IVIS spectrum. (C) Radiant efficiency was measured using living image 3.1 software. Data are presented as the mean ± SD values: *p < .05, ***p < .001.
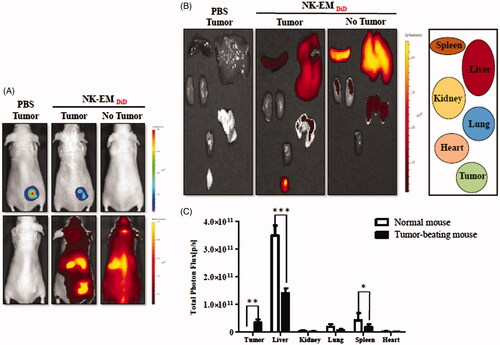
Figure 5. Scheme of the in vivo treatment experiments.
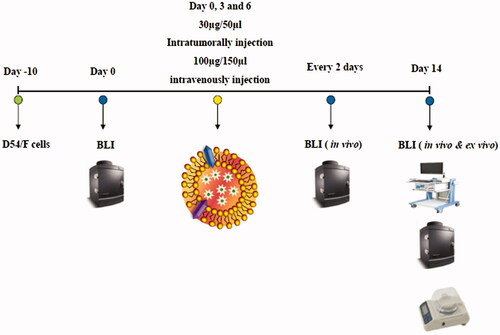
Figure 6. Immunotherapy with NK-EM in vivo. (A) BLI measurements of the D54/F activity in mice were performed in the control and treatment groups. In the treatment group, 100 µg or 30 µg of NK-EM was injected intravenously and intratumorally, respectively, three times every 72 h. (B) Quantitative BLI of D54/F activity. (C) BLI of the ex vivo tumour activity. (D) Quantitative BLI of ex vivo D54/F activity. (E) Ultrasound images were obtained in the B mode, and three-dimensional images were constructed. (F) Tumour volumes and tumour weight (G) were measured. Experiments were performed at least in triplicate and mean ± SD values are plotted; **p < .01 and ***p < .001.
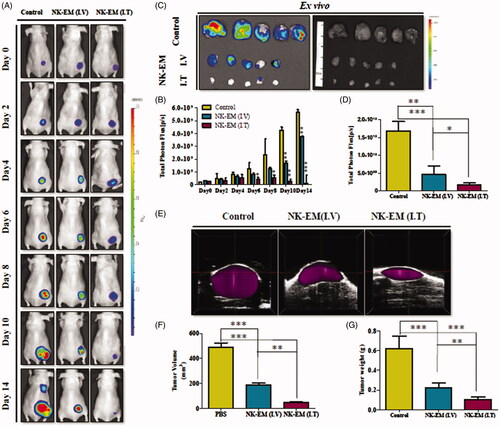
Figure 7. Trafficking of NK-Exo and NK-EM in cancer cells. DiD-labelled NK-Exo (A) and NK-EM (B) were used to treat D54/F cells, and confocal laser microscopy images were obtained. The scale bar denotes 20 and 10 µm, respectively.
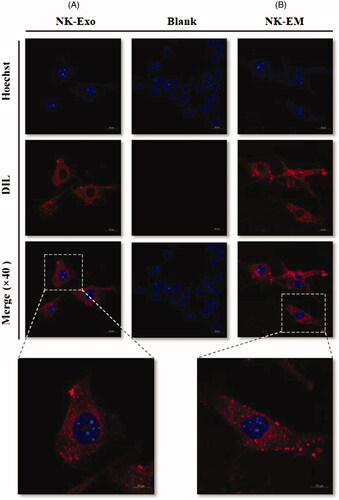
Figure 8. Identification of apoptosis-inducing proteins in NK-Exo and NK-EM. NK cells, NK-Exo, and NK-EM lysates were loaded into each lane (50 μg total protein; n = 3). (A) The apoptosis-inducing proteins FasL and perforin were detected in the lysates. Since FasL comprised a membrane associated form (FasL) and soluble homotrimeric form (sFasL), the membrane and cytoplasm were measured separately. (B) The abundance of FasL and perforin in the lysates was estimated using EvolutionCapt software. (C) To confirm the function of the FasL, the inhibitor was used and the BLI of the tumour was obtained. (D) CCK-8 assay was also performed as well. Experiments were performed at least in triplicate and values ± SD are plotted; *p < .05.
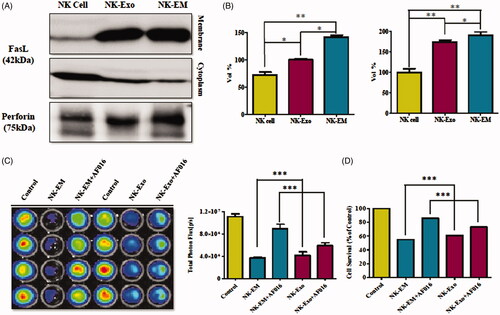
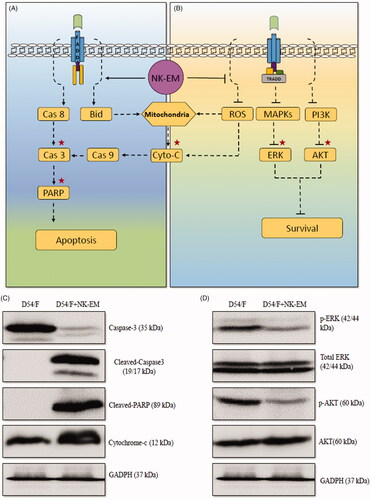
Figure 9. Effect of NK-EM on the apoptosis and cell proliferation pathways. After 24 h of co-incubation of D54/F with NK-EM, proteins were collected from the whole cell lysates and Western blotting was performed. Marker protein in the apoptosis (A) and proliferation (B) signalling pathways were checked. (C) Levels of apoptosis proteins, cleaved-caspase 3, cleaved-PARP, and cytochrome-C, were increased. (D) Coincidentally, levels of cell proliferation proteins p-ERK and p-AKT were decreased after NK-EM treatment.