Figures & data
Figure 1. The structure of FMSP-nanoparticles through scanning electron microscope (SEM) with 50,000 magnifications (a) and with 100,000 magnification (b). The structure of Fluorescent submicron magnetic nanoparticle through transmission electron microscope (TEM) with 70,000 magnifications (c) and with 180,000 magnification (d).
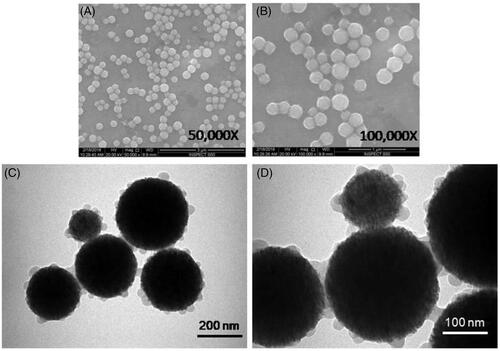
Figure 2. Cell morphology: the HCT-116 cells were non-treated (a) and treated with FMSP-nanoparticles (1.25 μg/mL) for 6 h (b), 24 h (c) and 48 h (d). 400× magnification.
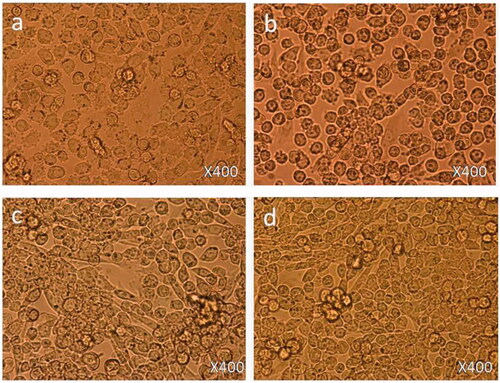
Figure 3. Cell morphology: the HCT-116 cells were non-treated (a) and treated with FMSP-nanoparticles (12.5 μg/mL) for 6 h (b), 24 h (c) and 48 h (d). 400× magnification.
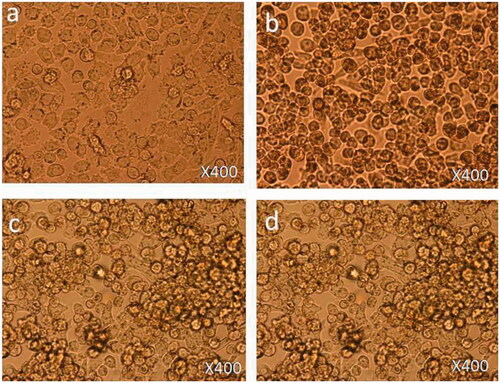
Figure 4. Cell morphology: the HCT-116 cells were non-treated (a) and treated with FMSP-nanoparticles (50 μg/mL) for 6 h (b), 24 h (c) and 48 h (d). 400× magnification.
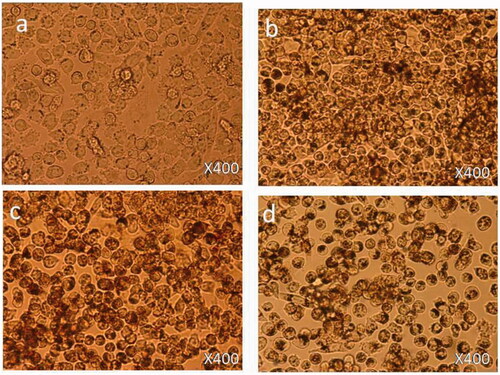
Figure 5. Cell viability analysis by trypan blue staining. Viability of HCT-116 cell line was decreased on concentration-dependent manner in comparison with control group (*p < .05, **p < .01 and ***p < .001).
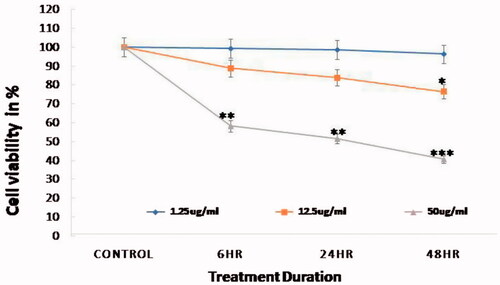
Figure 6. Cell viability analysis by MTT assay. The HCT-116 cells were treated with FMSP-nanoparticles (1.25 μg/mL, 12.50 μg/mL and 50 μg/mL) for 24 h and then subjected to the MTT staining assay. Data are the means ± SD of three different experiments. Difference between two treatment groups were analysed by Student’s t test where (*p < .05, **p < .01 and **p < .001), p values were calculated by Student’s t-test.
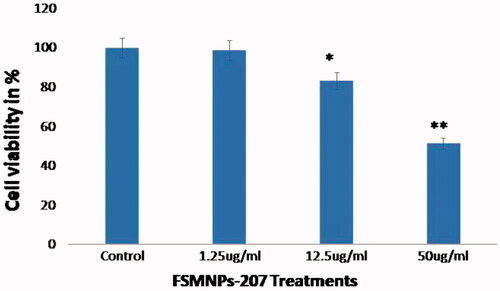
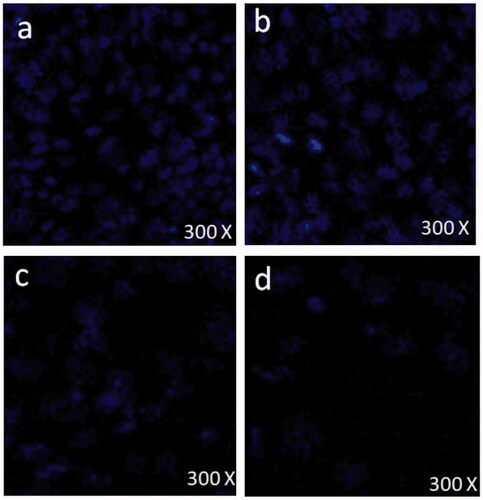
Figure 7. Confocal microscopic images of HCT-116 cells stained with DAPI: the control cells (without FMSP-nanoparticles treatment) (a); cells with FMSP-nanoparticles of dosages (1.25 μg/mL) (b); 12.5 μg/mL (c); and 50 μg/mL (d).