Figures & data
Figure 1. Dose–response relationship between hyaluronan and TGF-β1. The morphology of NECs changes from polygonal to irregular, detached and even aggregative shape with incubation of TGF-β1 (B–E). Scale bar =100 μm. Cell viability (F). RT-qPCR of FOXJ1 and E-cadherin under 5 ng/ml TGF-β1 plus various concentration of hyaluronan ranges from 0 mg/ml to 3 mg/ml (G, H). Results are expressed as the mean ± SD. Different letters (a, b) indicate a significant difference (p < .05), while the same letter indicates no significant difference (p > .05).
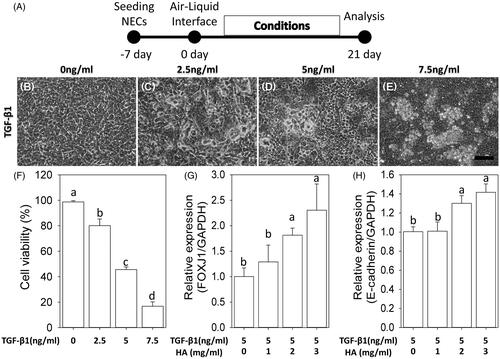
Figure 2. Morphology of NECs treated with TGF-β1 (5 ng/ml), TGF-β1 plus hyaluronan (2 mg/ml) and hyaluronan (A–D). Scale bar = 100 μm. Scanning electron micrographs (magnification ×2000) (E–H). TER is measured and normalized to controls (I). Results are expressed as the mean ± SD. Different letters (a, b) indicate a significant difference (p<.05), while the same letter indicates no significant difference (p>.05). TER: transepithelial electrical resistance.
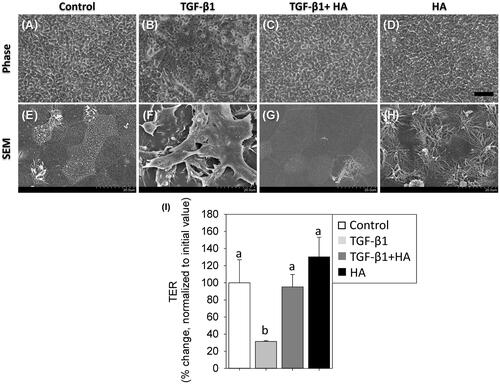
Figure 3. Immunofluorescent confocal images of ZO-1 (A–D), E-cadherin (E–H), N-cadherin (I–L) and vimentin (M–P) in NECs (H–J) are shown. Cellular cytoskeletal shape (F-actin) is outlined by rhodamine phalloidin. Nuclei are labelled with DAPI. Scale bar = 20 μm.
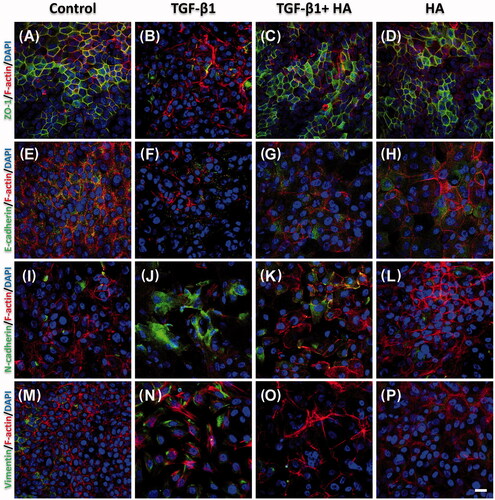
Figure 4. Western blot analyses of ZO-1, E-cadherin, N-cadherin and vimentin (A) in NECs treated with TGF-β1, TGF-β1 plus hyaluronan or hyaluronan. Densitometric analyses are shown (B–E). Results are expressed as the mean ± SD and significant differences are indicated by different letters (p< .05).
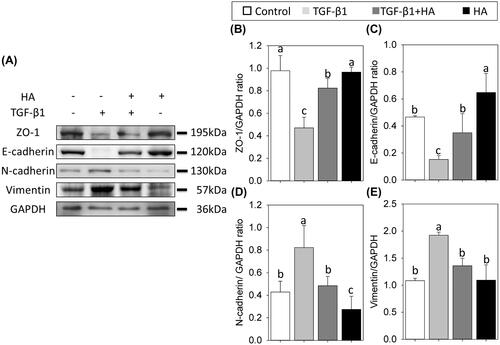
Figure 5. Observations of cilia using scanning electron micrographs (magnification ×15,000, scale bar = 3 μm) (A–D) and immunofluorescent confocal images of acetylated tubulin (E–H). Cellular cytoskeletal shape (F-actin) is outlined by rhodamine phalloidin. Nuclei are labelled with DAPI. Scale bar = 20 μm. Western blots and densitometric analyses of acetylated tubulin/GAPDH ratios are shown (I). Results are expressed as the mean ± SD and significant differences are indicated by different letters (p < .05).

Figure 6. Mucin-secreting cells are virtualized using immunofluorescent confocal images of MUC5AC (A–D) and evaluated by western blots at day 21 after confluence. Cellular cytoskeletal shape (F-actin) is outlined by rhodamine phalloidin. Nuclei are labelled with DAPI. Scale bar = 20 μm. Densitometric analysis of MUC5AC/GAPDH ratios is shown (E, bottom). Results are expressed as the mean ± SD and significant differences are indicated by different letters (p < .05).
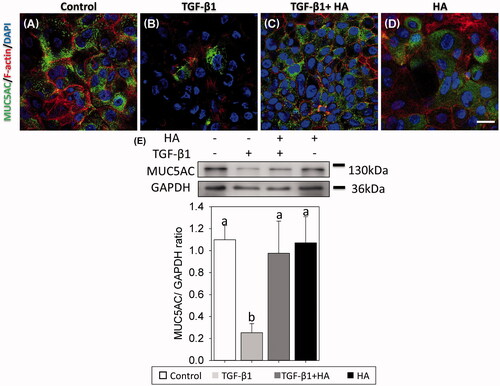
Figure 7. Hyaluronan down-regulates phosphorylation of TβR1 and reduces TGF-β/Smad signalling of NECs. Phospho-TβR1, TβR1, phospho-TβR2, TβR2, phospho-Smad2, phospho-Smad3 and Smad2/3 expression are examined by western blot analyses (A). Densitometric analysis is shown (B–E). Results are expressed as the mean ± SD and significant differences are indicated by different letters (p < .05). TβR1: type 1 transforming growth factor receptor. TβRII: type 2 transforming growth factor receptor.
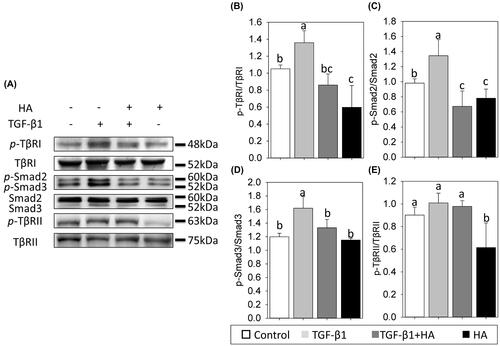
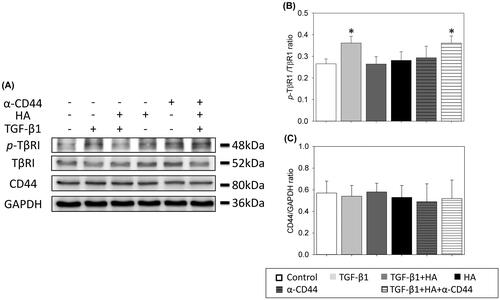
Figure 8. Hyaluronan-mediated down-regulation of phosphorylation of TβR1 is prevented with blocking antibodies to CD44. CD44, phospho-TβR1 and TβR1 expressions are examined by western blot analyses (A). Densitometric analysis is shown (B). Results are expressed as the mean ± SD and significant differences are indicated by asterisk (p< .05). α-CD44: blocking antibodies to CD44. TβR1: type 1 transforming growth factor receptor.