Figures & data
Figure 1. UV–Vis spectra of Ag, Cu and TiO2 NPs; Ag–TiO2, TiO2–Ag, Ag–Cu, and Cu–Ag NCs prepared by flower aqueous extract of A. haussknechtii.
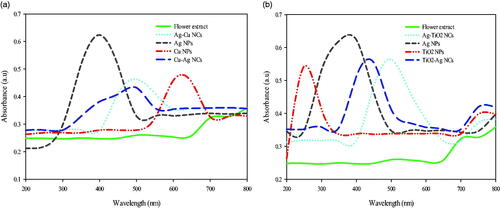
Figure 2. XRD analysis of green synthesized Ag–Cu and Cu–Ag (a); Ag–TiO2 and TiO2–Ag (b) NCs.
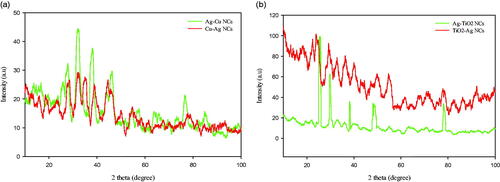
Figure 3. FT-IR spectra of Ag–Cu (a); Cu–Ag (b); Ag–TiO2 (c) and TiO2–Ag NCs (d) with their main peaks.
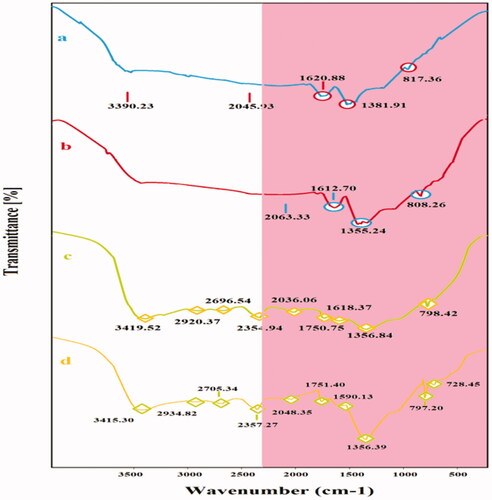
Figure 4. SEM images of Ag–TiO2 (a, b, c, d); TiO2–Ag (e, f, g, h); Ag–Cu (i, j, k, l) and Cu–Ag (m, n, o, p) NCs.
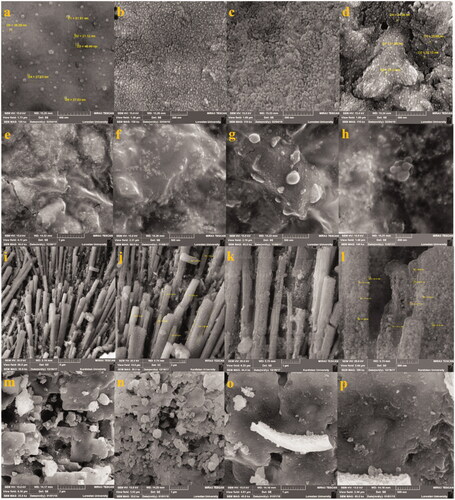
Figure 5. EDX analysis of Ag–TiO2 (a); TiO2–Ag (b); Ag–Cu (c) and Cu–Ag (d) NCs.
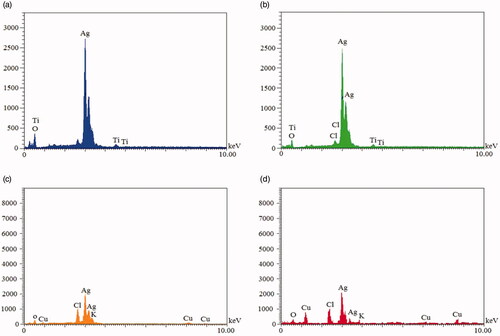
Figure 7. Agar well diffusion assay of Ag–TiO2 (a); TiO2–Ag (b); Ag–Cu (c) and Cu–Ag NCs (d) on three MDR bacterial species: E. coli, S. aureus and P. aeruginosa.
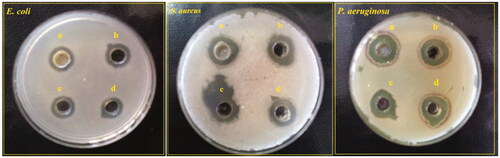
Table 1. Antibacterial activity of Ag–TiO2, TiO2–Ag, Ag–Cu and Cu–Ag NCs as values of obtained IZD by agar well diffusion assay.
Figure 8. MIC (a) and MBC (b) of four NCs against E. coli ATCC 25922, S. aureus ATCC 43300 and P. aeruginosa ATCC 27853.
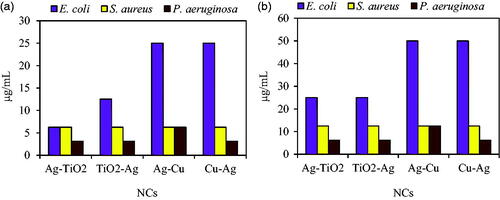
Figure 9. Reduction of swarming mobility in P. aeruginosa ATCC 27853 under two concentrations (3.12 and 6.25 μg/mL) of four NCs compared to control samples.
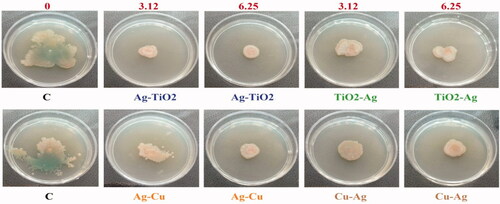
Figure 10. Effects of different concentrations of (a) Ag–TiO2; (b) TiO2–Ag; (c) Ag–Cu and (d) Cu–Ag NCs on the biofilm formation by E. coli ATCC 25922, S. aureus ATCC 43300 and P. aeruginosa ATCC 27853 after 24 h incubation without shaking at 37 °C. Data are presented as Mean ± SD and (*) sign is p ≤ .05 value versus control samples.
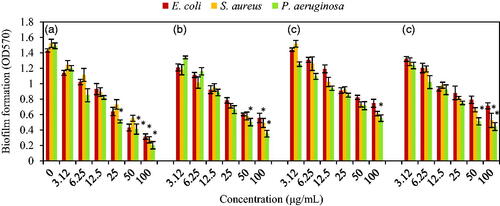
Figure 11. AFM 3-D images of biofilm formation after 24 h of NCs incubation; control (a); Ag–TiO2 (b); TiO2–Ag (c); Ag–Cu (d) and Cu–Ag NCs (e) with changing of roughness values (f). Significant difference is at *p ≤ .05.
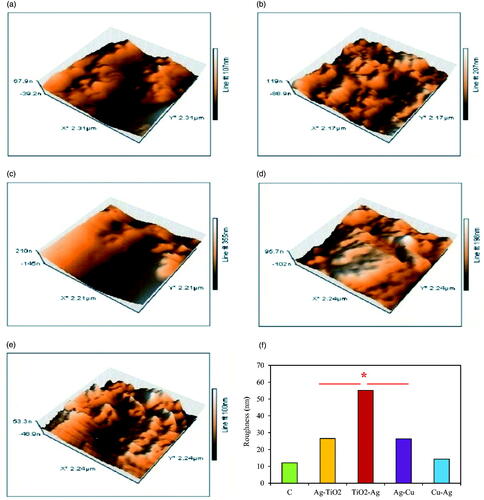
Figure 12. Changing of typical biofilm morphology of P. aeruginosa as reduction in biofilm surface area and density after 24 h without NCs as control (a, b, c) and under Ag–TiO2 NCs as treatment (d, e, f). Imaging is based on the magnifications of ×500 (a, d), ×1000 (b, e) and ×2000 (c, f).
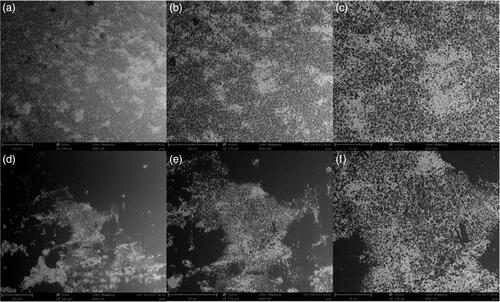
Figure 13. Reduction of pyocyanin amount as virulence factor of P. aeruginosa ATCC 27853 under treatment by different concentrations of Ag–TiO2 NCs. (significant difference, ANOVA (Tukey’s test), *p ≤ .05). Data were presented as mean values of three replicates ± error bars of standard deviation.
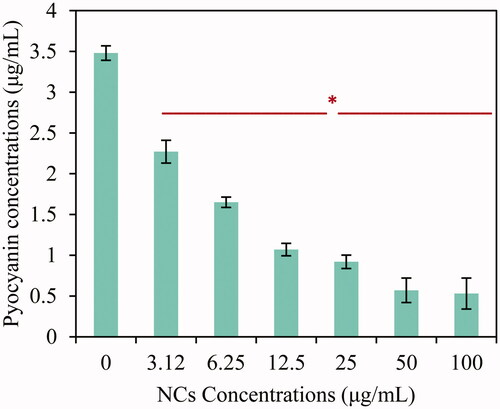
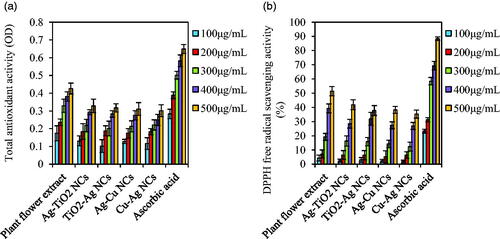
Figure 14. TAC and DPPH free radical scavenging activity of flower extract and four NCs. Ascorbic acid was used as standard solution. Values are means of three independent analyses ± standard deviation (n = 3).