Figures & data
Table 1. Primer sequences and conditions used for qPCR.
Figure 1. Phase contrast microscopy images of A) hiPSC colones on MEFs inactivated feeders B) embryoid bodies (EBs) EBs in hanging culture medium (×100 magnifications).
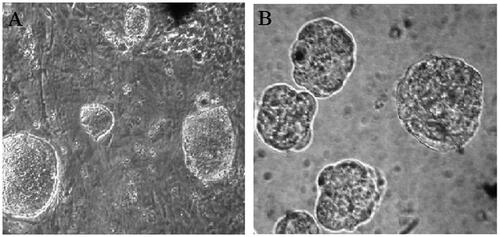
Figure 2. Three-dimensional electron micrograph images of (A) unseeded hybrid PLLA/PCL scaffolds (B) hiPSCs-seeded scaffold on starting day (C) induction cells to assembling (D) induced cells became to aggregate (E) islet-like clusters. Scale bars are A: 10 µm- B, C, D, E: 100 µm.
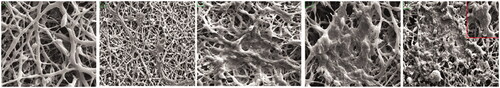
Figure. 3 Morphological changes of hiPSCs during differentiation on gelatin coated palates (A) began to assembled hiPSCs (B) aggregated induced cells (C) differentiated beta- like pancreatic cells. (×100 magnifications).
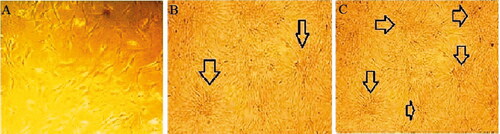
Figure 4. (A) Quantitative transcriptional analysis of pluripotent and endodermal markers. (B) Relative pancreatic gene expression in end stage derived IPCs. *Significance was defined as p < 0.05 and values represent means ± SD.
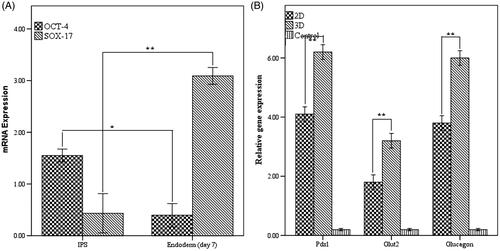
Figure 5. Immunocytochemistry staining showed (A) insulin and C-peptide expression in end stage derived pancreatic cells on hybrid scaffold. (B) Insulin and C-peptide protein, the main markers of beta- like pancreatic cells in matured cells in 2D group. Nuclei were stained with DAPI. Data are presented as mean ± SEM. (× 100 magnifications).
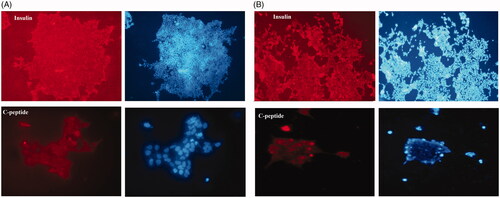
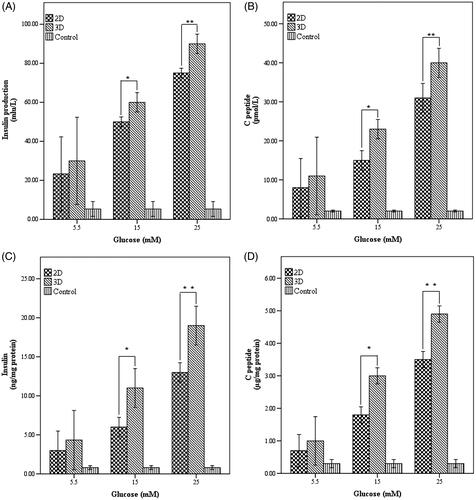
Figure 6. Insulin and C-peptide production in response to glucose in end stage of differentiation. (A) Insulin production and (B) C-peptide release pattern in the studied cultures and control group in response to different concentrations of glucose (C) Insulin normalized with total cellular protein D) C-peptide normalized with total cellular protein. *Significance was defined as p < .05 and values were presented as means ± SD.