Figures & data

Figure 1. UV–Vis spectra of the HsAFr, HsAFr–Epr and HsAFr–Epr–FA complexes.
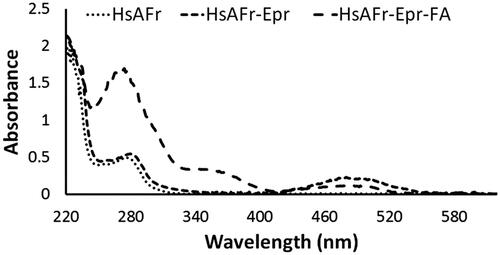
Figure 2. Apoferritin fluorescence spectra in the HsAFr, HsAFr–Epr and HsAFr–Epr–FA complexes. The excitation wavelength was set at 295 nm.
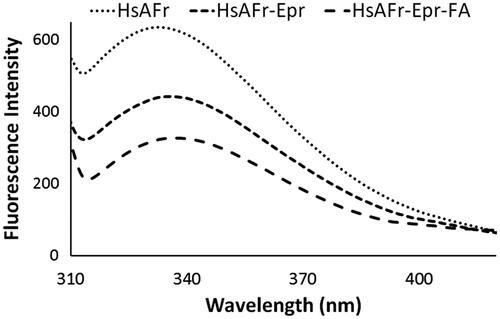
Figure 3. Epirubicin fluorescence spectra in the Epr solution, HsAFr–Epr and HsAFr–Epr–FA complexes. The excitation wavelength was set at 482 nm.
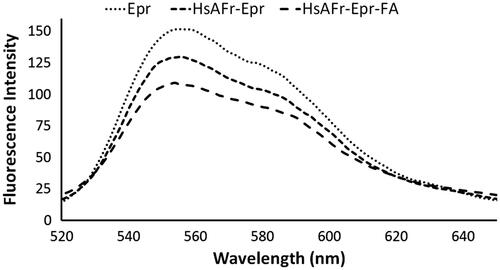
Figure 4. Folic acid fluorescence spectra in the FA solution and HsAFr–Epr–FA complexes. The excitation wavelength was set at 350 nm.
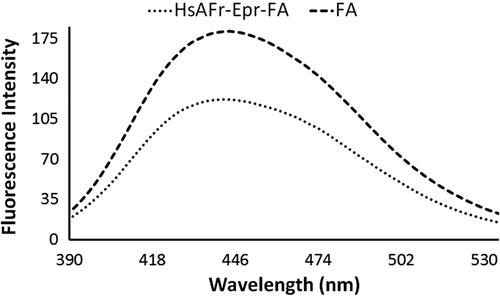
Figure 5. CD spectra of the HsAFr, HsAFr–Epr and HsAFr–Epr–FA complexes.
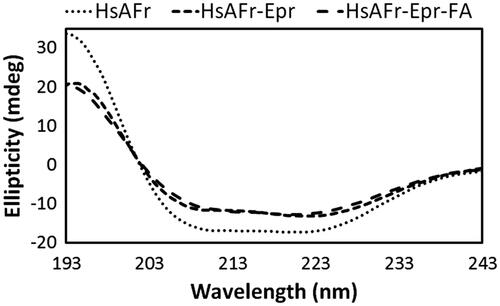
Figure 6. TEM image of negatively stained HsAFr–Epr with uranyl acetate. The presence of HsAFr and HsAFr–Epr has been indicated in black and white arrows.
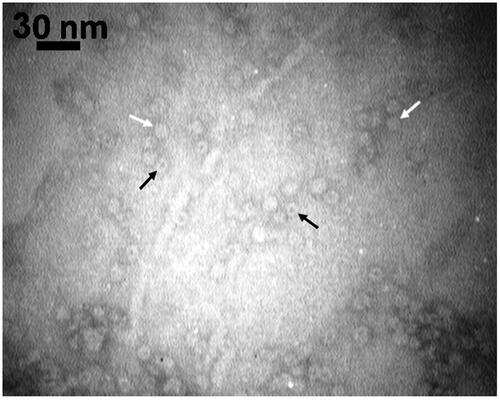
Figure 7. Percentages of the cumulative drug release of Epr from Epr loaded HsAFr at pH 7.4 and 5.0.
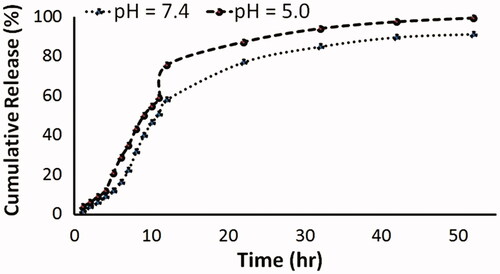
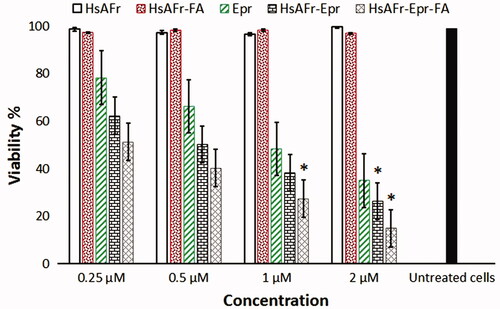
Figure 8. The effect of HsAFr, HsAFr–FA, Epr, HsAFr–Epr and HsAFr–Epr–FA concentrations on viability of MCF-7 cell line after 24 h. The results are presented as the means ± SD (n = 3). *p < .05.
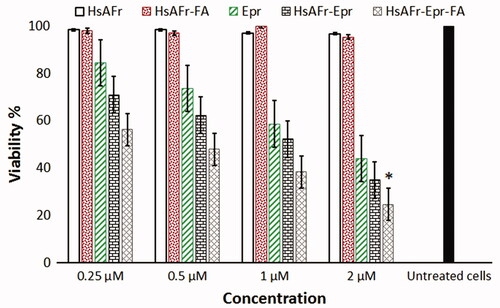
Figure 9. The effect of HsAFr, HsAFr–FA, Epr, HsAFr–Epr and HsAFr–Epr–FA concentrations on viability of MCF-7 cell line after 48 h. The results are presented as the means ± SD (n = 3). *p < .05.
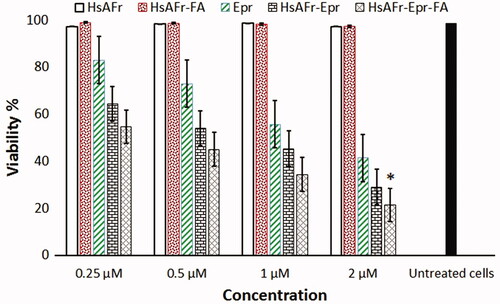
Figure 10. The effect of HsAFr, HsAFr–FA, Epr, HsAFr–Epr and HsAFr–Epr–FA concentrations on viability of MCF-7 cell line after 72 h. The results are presented as the means ± SD (n = 3). *p < .05.