
Figures & data
Figure 1. Visible and UV-vis spectra of AuNPs (A) and AgNPs (B). The purple and brownish color with absorbance spectra at 540 and 440 nm showed the formation of AuNPs and AgNPs in the respective reaction mixture since the color and absorbance is due to the surface plasmon resonance of synthesized nanoparticles. UV-visible spectra showing unchanged SPR for AuNPs and AgNPs, freshly prepared nanoparticles (A,B), purified nanoparticles (C,D), at the time of synthesis and one month after (E,F). The plant extract and nanoparticles are shown as insets in panels A and B.
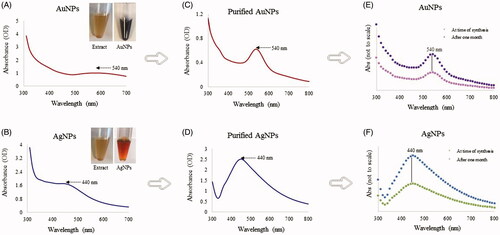
Figure 2. Optimization studies based on the UV-vis spectral analysis for AuNP and AgNP production by the R. rosea rhizome extract. The optimized parameters for AuNPs were: reaction mixture ratio (extract:water) (A) and gold salt concentration (B). The optimized parameters for AgNPs were as follows: the reaction mixture ratio (extract:water) (C), temperature (D), time (E) and silver salt concertation (F). The photograph of test tubes with optimizing concentrations is shown next to respective figures.
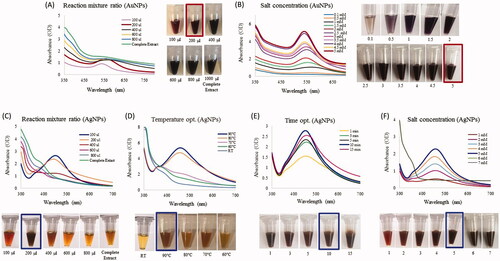
Figure 3. Matrix-assisted laser desorption ionization-time of flight (MALDI-TOF) spectra for AuNPs (A) and AgNPs (B).
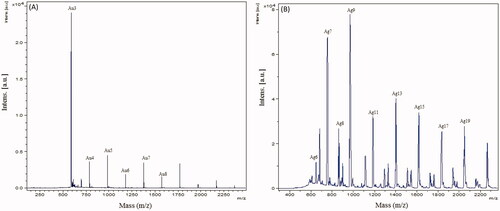
Figure 4. Transmission electron microscopy (TEM) images of nanoparticles showing the particle shape of AuNPs (A,B) and AgNPs (C,D) and the selected area diffraction pattern (SAED) of AuNPs (E,F) and AgNPs (G,H), with respective SAED apertures. From these images, the size of nanoparticles with crystalline nature was estimated at 13–17 nm for AuNPs and 15–30 nm for AgNPs. The AFM analysis of nanoparticles for AuNPs and AgNPs is shown in panels (I) and (J), respectively.
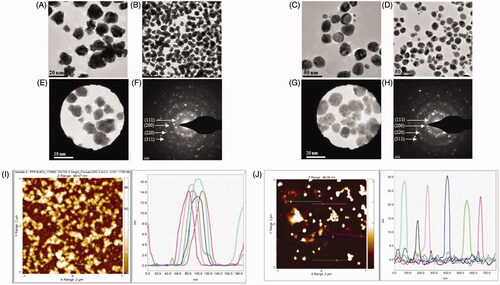
Figure 5. Particles size distribution of AuNPs (A) and AgNPs (B). Zeta potential analysis shows the surface charge on nanoparticles with respect to the total number of nanoparticles present in the solution for AuNPs (C) and AgNPs (D). This study has been done in triplicates.
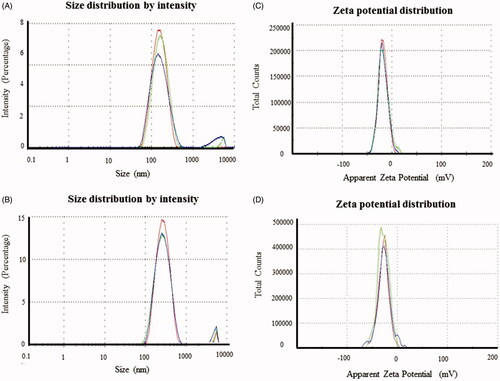
Figure 6. FT-IR spectra of rhizome extract (A), AuNPs (B) and AgNPs (C) for the identification of functional groups and interactions between molecules and the nanoparticle surfaces.
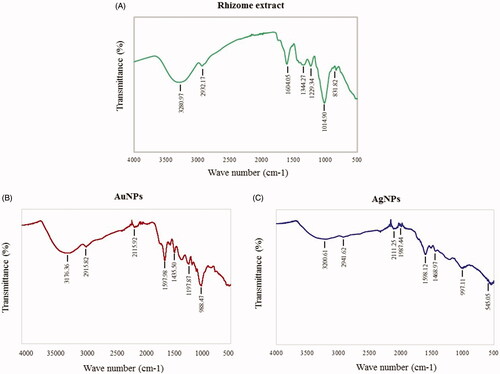
Table 1. Main features FT-IR spectra of R. rosea rhizome extract, AuNPs and AgNPs.
Figure 7. ICP-MS measurement of AuNPs (A) and AgNPs (B) of freshly prepared nanoparticles which shows the size distribution histogram. ICP-MS measurements were performed initially and after two weeks of incubation to analyze the nanoparticles stability for AuNPs (C) and AgNPs (D). The dwell time was set to 50 µs and the scan time to 100s. Thermogravimetric analysis (TGA) measurement of AuNPs (E) and AgNPs (F), which shows the complete nanoparticles degradation at high temperature.
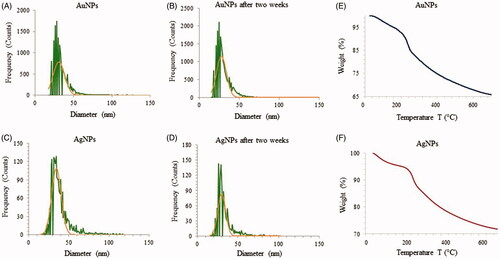
Figure 8. Effect of AuNPs and AgNPs on bacterial biofilm formation. P. aeruginosa (A, B) and E. coli (C, D). All the experiments were performed in biological triplicates, data represent mean ± SD. *p < .05, **p < .005 and ***p < .001.
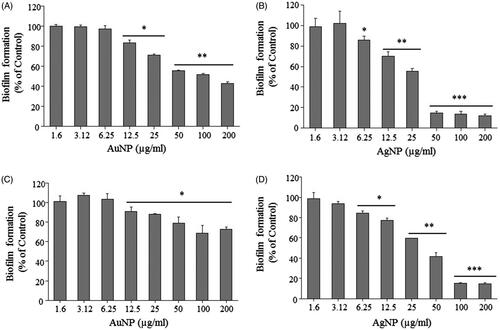
Figure 9. Effect of AgNPs on the growth of P. aeruginosa PA01(A) and E. coli UTI89 (B) at sub-MIC levels. All the experiments were performed in biological triplicates, data represent mean ± SD.
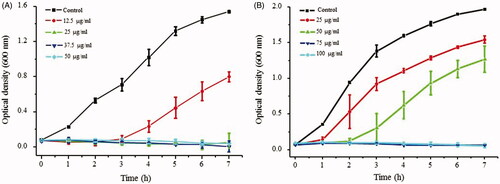
Figure 10. Effect of AgNP on bacterial adhesion on the nanoparticle coated glass surface. P. aeruginosa (A) and E. coli (B). All the experiments were performed in biological triplicates, data represent mean ± SD. *p < .05, **p < .005 and ***p < .001.
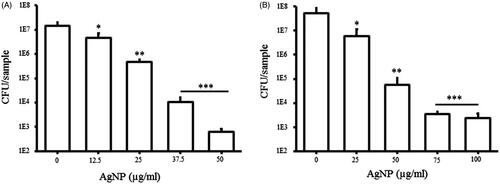
Figure 11. Representative fluorescence microscopic images of bacterial biofilms on the AgNP coated glass surface. P. aeruginosa (A) and E. coli (B) were cultured for 5 h on the control and nanoparticle-coated surface and stained with live/dead staining before imaging with a fluorescence microscope.
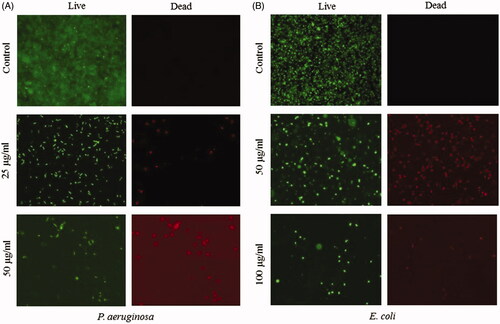
Table 2. MIC and MBC of AgNPs against P. aeruginosa and E. coli. MIC and MBC of AgNPs were >200 μg/ml against both bacterial strains.