Figures & data
Scheme 1. Synthesis of HA-ss-ATRA/TPENH2 conjugates (A). Illustration of the self-assembly, accumulation at cancer cells, intracellular trafficking pathway of redox-sensitive AIE HNPs, and real-time intracellular imaging of AIE HNPs (B). Circulation of AIE HNPs within vessel (a); Accumulation of DOX-loaded HNPs within the tumor site through passive and active targeting effects (b); CD44 receptor-mediated cellular internalization (c, d); Endo/Lysosomal escape, and GSH-controllable release of DOX in cytoplasm (e, f); Released DOX into nucleus for apoptosis and cytotoxicity (g).
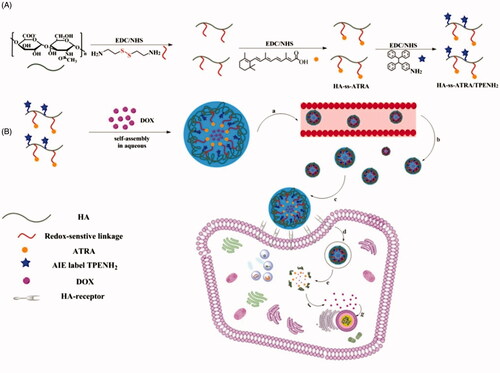
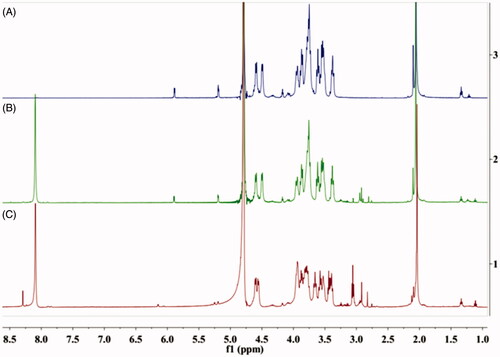
Figure 1. 1H NMR spectra of HA (A), HA-ATRA conjugate (B) and HA-ss-ATRA conjugate (C).
Scheme 2. Synthetic scheme of TPENH2 molecule.
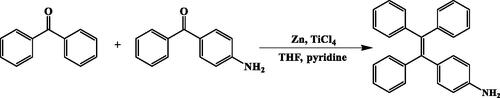
Figure 2. UV-vis spectra of TPENH2, HA-ss-ATRA and HA-ss-ATRA/TPENH2 conjugates.
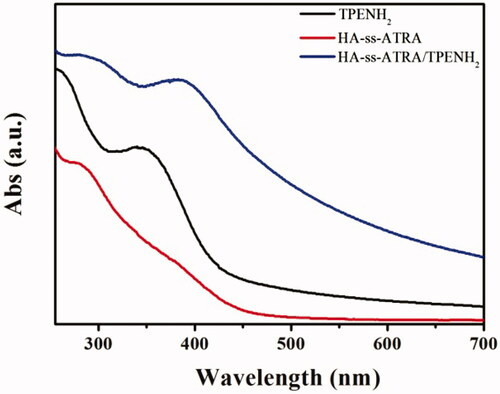
Figure 3. Representative SEM images (A) and TEM images (B) of HA-ss-ATRA/TPENH2 HNPs. size distribution of HA-ss-ATRA/TPENH2 HNPs (C).
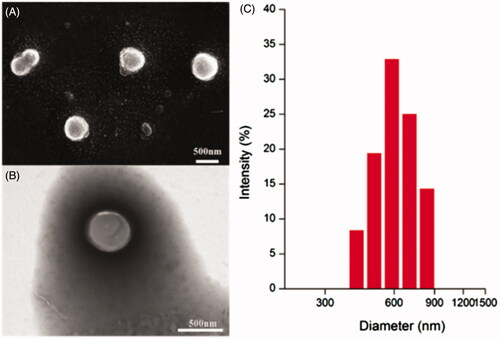
Figure 4. GSH triggered DOX release from HA-ss-ATRA/TPENH2 HNPs and HA-ATRA/TPENH2 HNPs. The error bars in the graph represent standard deviations (n = 3).
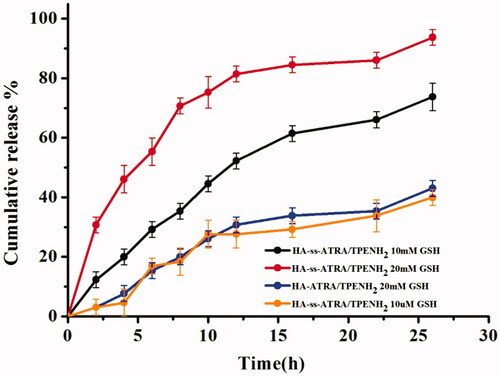
Figure 5. Cell viability of HepG-2 cells treated with DOX-loaded HA-ss-ATRA/TPENH2 HNPs and free DOX after 24 h (A). Cell viability of HepG-2 cells treated with DOX-loaded HA-ss-ATRA/TPENH2 HNPs and free DOX after 24 h, 48 h and 72 h (B). Cytotoxicity of blank HA-ss-ATRA/TPENH2 HNPs against HepG-2 cells and 293T cells (C). Cell viability of HepG-2 cells treated with DOX-loaded HA-ss-ATRA/TPENH2 HNPs and DOX-loaded HA-ATRA/TPENH2 HNPs (D). Cell survival fractions were assessed by MTT assay. Data represent mean ± SD (n = 5).
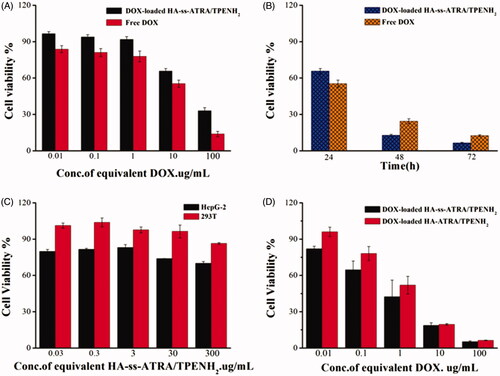
Table 1. IC50 of Free DOX and DOX-loaded HNPs for HepG-2 cells.
Figure 6. Cell viability of HepG-2 and 293T cells treated with DOX-loaded HA-ss-ATRA/TPENH2 HNPs after 48 h.
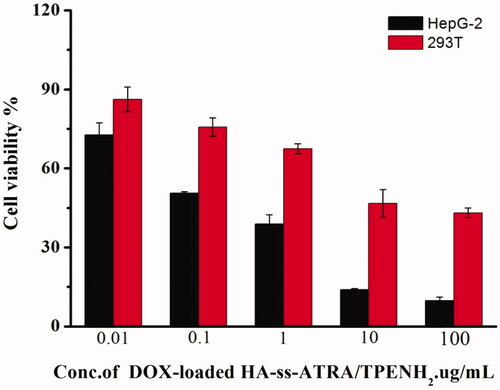
Figure 7. Fluorescence microscopy images of HepG-2 cells incubated with HA-ss-ATRA/TPENH2 HNPs (A), free DOX (B) and DOX-loaded HA-ss-ATRA/TPENH2 HNPs (C) for 8 h. For each panel, left to right show the UW, GW, bright and merge field images. Scale bars correspond to 10 μm in all the images.
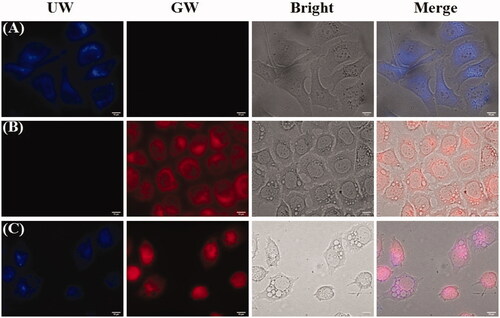
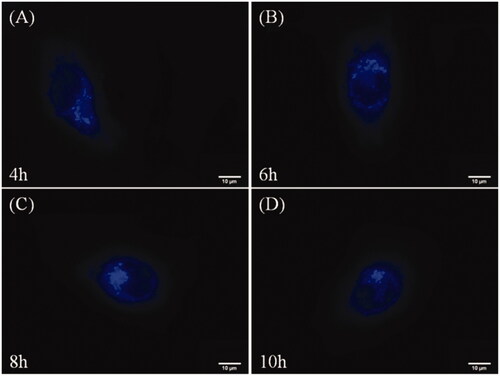
Figure 8. Fluorescence microscopy images of HepG-2 cells incubated with HA-ss-ATRA/TPENH2 HNPs for 4 h(A), 6 h(B), 8 h(C) and 10 h(D). Scale bars correspond to 10 μm in all the images.