Figures & data

Figure 1. (A) The chemical structures of CK and parthenolide. The effects of (B) CK or (C) parthenolide on A549 cellular proliferation. (D) The cooperativity index (CI) of parthenolide (1.5 μg/mL) combined with the indicated concentrations of CK. (E) Cells were photographed after treated with CK and parthenolide (at ratios weight = 5:1) for inhibited cellular proliferation evaluation.
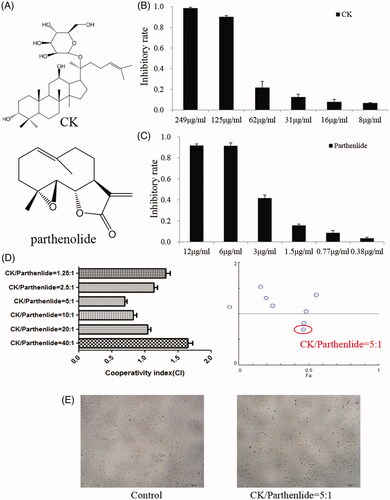
Figure 2. (A) Sizes of the liposome preparations. (B,C) Morphology of the liposome preparations, observed by TEM and atomic force microscopy of the liposome preparations. (D) Uptake and (E) internalization of the liposome preparations by A549 cells.
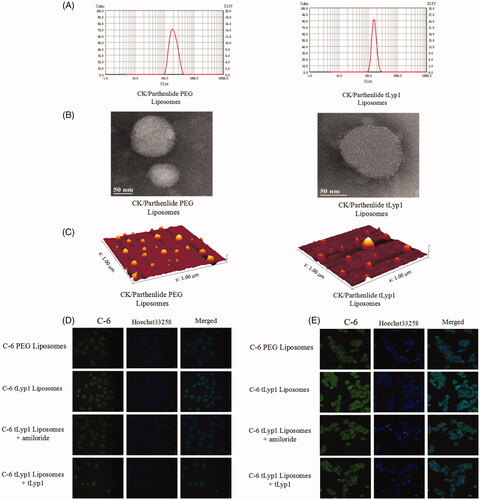
Figure 3. Intracellular endolysosomal escape behavior (A) in vitro and (B) in vivo imaging assay.
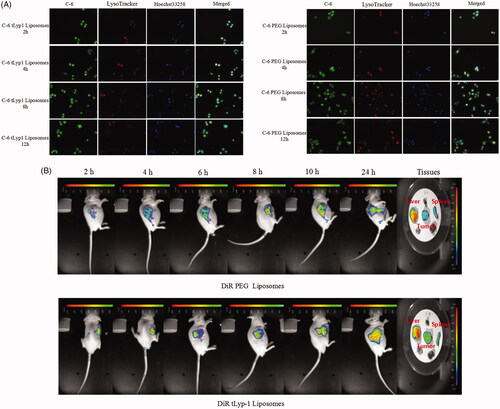
Figure 4. (A) Apoptosis and (B) ROS levels were quantified by flow cytometry. Then (C) mitochondrial ultrastructure changed and (D) MMP were observed in A549 cells.
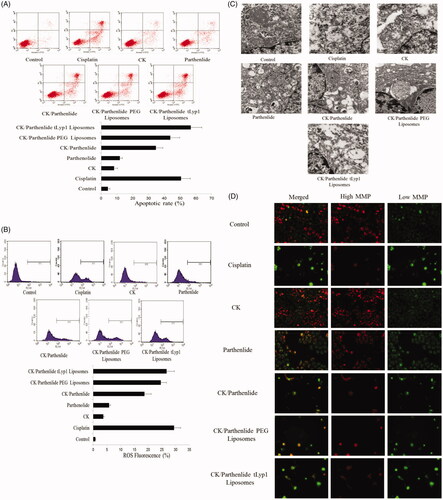
Figure 5. (A) MMP was quantified by flow cytometry. (B) Effects on cytochrome c and (C) Ca2+ were observed in A549 cells. (D) Wound healing assay was used to indicate the inhibition ratio.
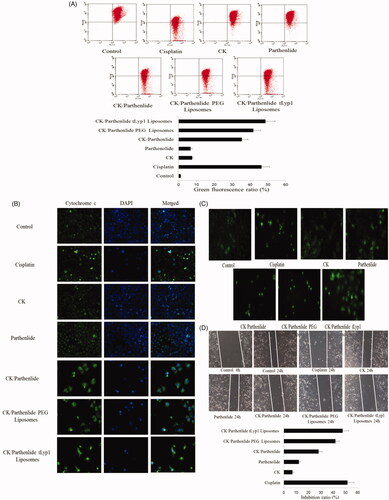
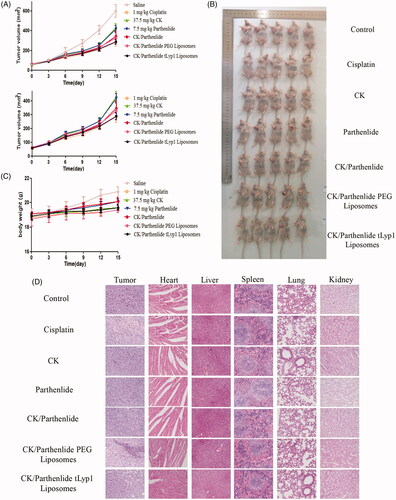
Figure 6. In vivo antitumor efficacy in mice with subcutaneous A549 tumors. (A) Tumor volume over time after treatment. (B) Photographs of mice containing subcutaneous A549 tumors at the end of the experiment. (C) Change in mouse body-weight over time. (D) Images of hematoxylin and eosin-stained sections of the indicated tissues.