
Figures & data
Figure 1. Schematic illustration of the sequence-specific DNA detection using a 2-AP-containing split G-quadruplex (ASG). S1 and S2 are two split G-rich segments linked to a target-specific overhang sequence with S1 only containing 2-AP.
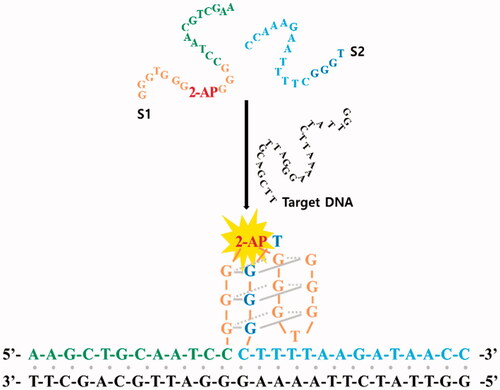
Figure 2. The effect of the G-quadruplex split ratio on the target DNA-induced fluorescence enhancement. (a) Schematic illustration of the 2-AP-containing split G-quadruplex structure with different split ratios (1:1, 3:1, 1:3, 2:1 and 1:2) in the presence of target DNA. (b) The signal-to-background ratio (F-F0)/F0, where F0 and F are fluorescence signals in the absence and presence of target DNA, respectively (Figure S2). The final concentrations of S1, S2, and target DNA were 2 μM.
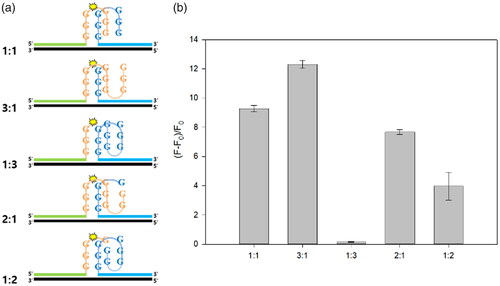
Figure 3. Detection feasibility of the new sensor. (a) Fluorescence intensities and (b) polyacrylamide gel electrophoresis images for samples under different conditions. (1: target DNA; 2: S1; 3: S2; 4: S1 + S2; 5: target DNA + S1 + S2). The final concentrations of S1, S2 and target DNA were 2 μM.
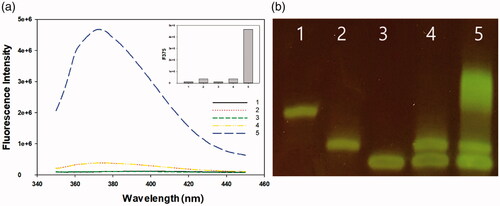
Figure 4. Detection sensitivity of the new sensor. (a) Signal-to-background ratios and (b) linear range of the plot of (F−F0)/F0 versus target DNA concentration (0–1000 nM). The final concentrations of S1 and S2 were 2 μM.
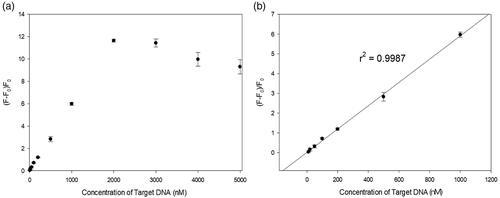
Figure 5. Detection selectivity of the new sensor. The target DNA is Chlamydia trachomatis (CT) and not-target DNAs are Mycoplasma genitalium (MG), Staphylococcus aureus (SA), Neisseria gonorrhoeae (NG), Herpes type 1 virus (HSV1) and Klebsiella pneumonia (KP). The final concentrations of S1, S2, target DNA and non-target DNAs were 2 μM.
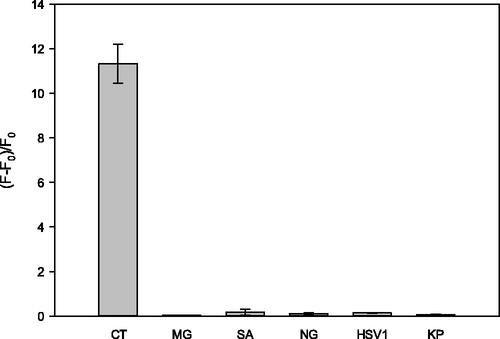
Table 1. Determination of target DNA in human serum.