Figures & data
Figure 1. Scheme of particle preparation through the one-pot fabrication technique. Two mixtures of inorganic solutions, MnCl2 containing haemoglobin and Na2CO3 with Odex, are mixed together. Here, MnCO3 particles are formed with entrapped biopolymers; meanwhile, the Hb is cross-linked by Odex in the particle. HSA was absorbed into particle surface. The MnCO3 template is then dissolved and the pure biopolymer particles remain in the solution.
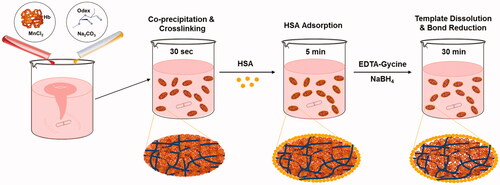
Figure 2. (A) Hb entrapment efficiency of MnCO3 template. (B) The absolute amount of entrapped protein by different initial Hb concentration. Hb content of Hb-MnCO3 was independent of the initial protein amount and it was not able to increase by increasing the initial Hb concentration. Data are presented as mean ± SD (n = 5).
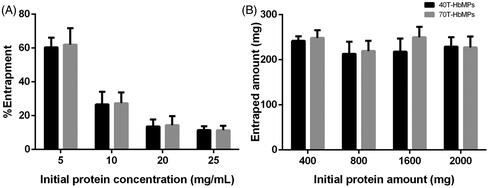
Figure 3. SEM images of (A,B) 40T-HbMP and (D,E) 70T-HbMP show a peanut-like shape. Cryo-SEM images of (C) 40T-HbMP and (F) 70T-HbMP show a smooth surface of the particles.
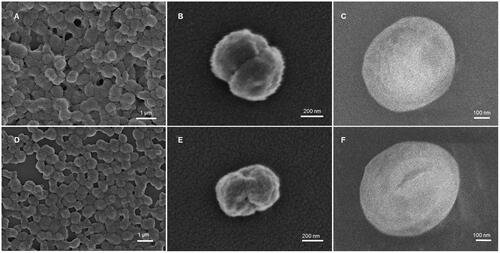
Figure 4. Characterization of Odex-HbMP samples. Size (A) and zeta-potential (B) measured in 10 mM PBS (conductivity 18–20 mS/cm) at room temperature by dynamic light scattering analysis. Data are presented as mean ± SD (n = 5).
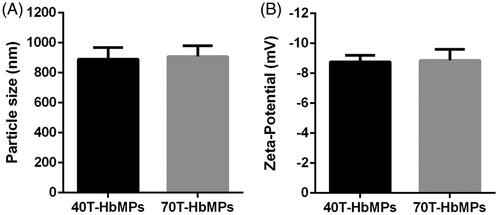
Figure 5. Deformability of Odex-cross-linked particles. (A) Compression and dilation behaviour of particles, the profile from the analytical centrifuge. (B) AFM images of 40T-HbMP in dry as well as wet state. (C) The width of the particles is defined as the horizontal distance and (D) the thickness of the particles is given as the vertical distance between the mica support and the top of the particle. Dried HbMP swelled after water was added. Data are presented as mean ± SD (n = 5), p < .05.
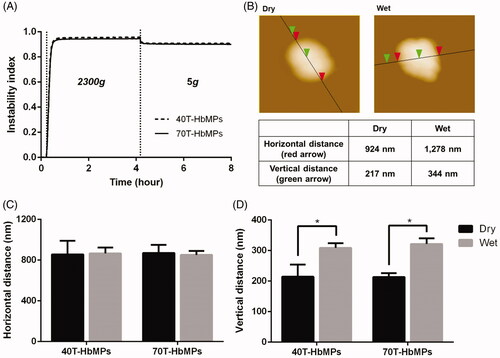
Figure 6. Absorption spectra of oxygenated Hb (OxyHb), deoxygenated Hb (DeoxyHb), oxygenated HbMP (OxyHbMP) and deoxygenated HbMP (DeoxyHbMP). A shift towards higher absorption of HbMP is a result of light scattering.
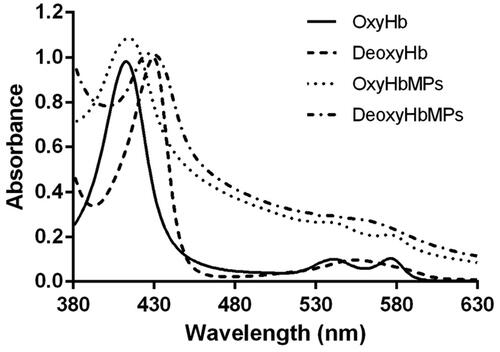
Figure 7. Stability of HbMP over 90 days. (A) Hb content of HbMP, (B) concentration of functional Hb (B) and (C) size stability by DLS analysis. Data are presented as mean ± SD (n = 3).
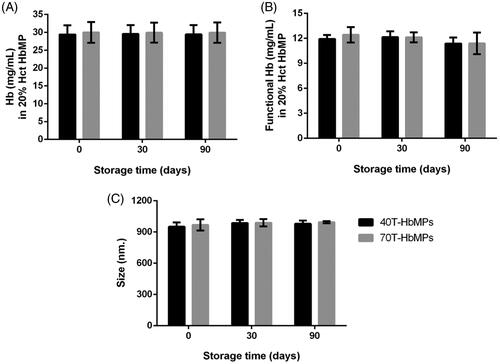
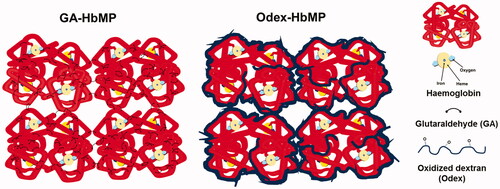
Figure 8. Schematic presentation of Hb cross-linking by Odex versus cross-linking by GA.