Figures & data
Table 1. The effect of nanodiamond concentration, which adsorbed on PMMA nanofibers and pH medium on the immobilization efficiency of HRP.
Figure 1. ATR-FT-IR spectra of ND, nfPMMA, nfPMMA-ND and nfPMMA-ND-HRP samples.
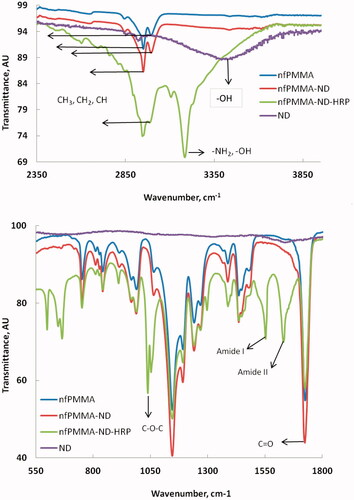
Figure 2. SEM Images of (a) nfPMMA low magnification (b) nfPMMA high magnification (c) nfPMMA-ND low magnification (d) nfPMMA-ND high magnification.
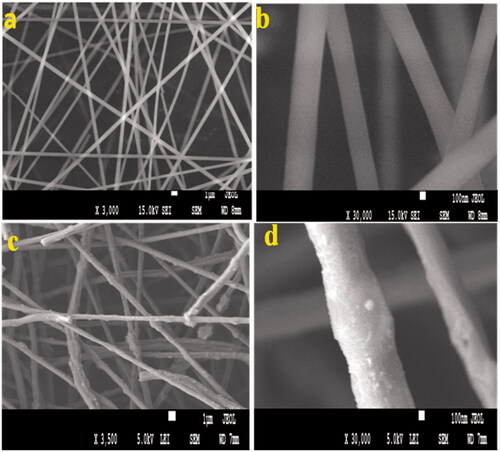
Figure 3. SEM Images of (e) nfPMMA-ND-HRP low magnification (f) nfPMMA-ND-HRP high magnification.
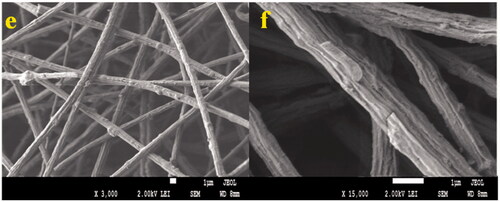
Figure 4. TEM Images of (a) nfPMMA-ND-HRP with 10 µm scale (b) nfPMMA-ND-HRP 0.5 with µm scale (c) nfPMMA-ND-HRP with 50 nm scale.
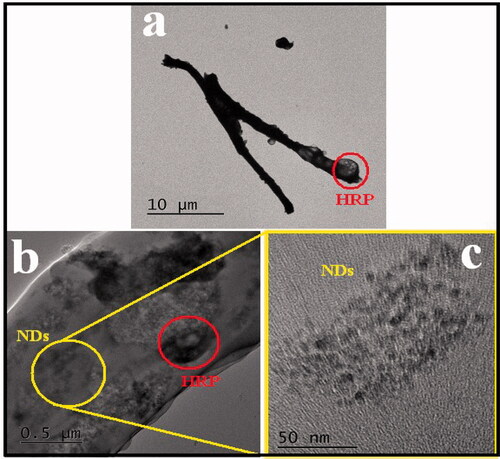
Figure 5. Reuse of immobilized HRP. Each point represents the mean of three experiments ± SE.
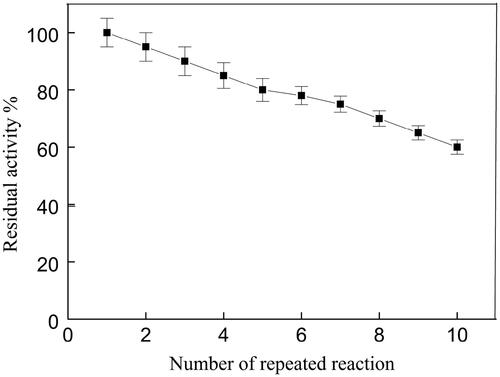
Figure 6. Optimum pH of soluble and immobilized HRP. The enzyme activity was measured at different pH’s ranging from 4.0 to 9.0. Each point represents the average of two experiments.
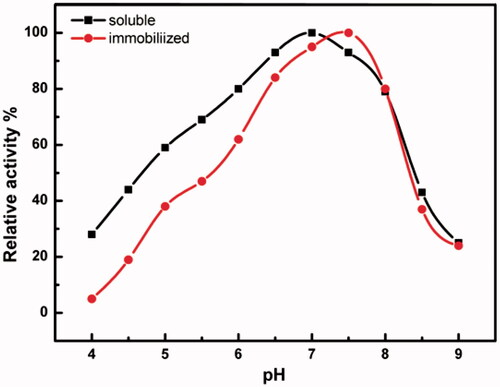
Figure 7. Optimum temperature of soluble and immobilized HRP. The enzyme activity was measured at different temperatures ranging from 30 to 80 C. Each point represents the average of two experiments.
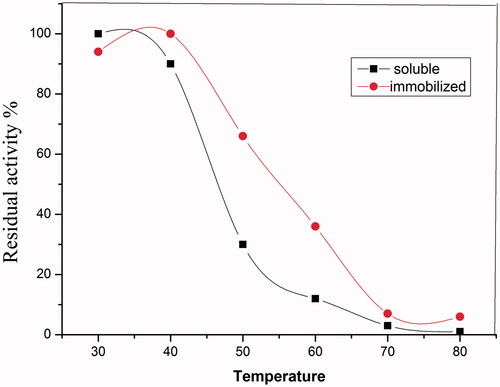
Figure 8. Effect of temperature on the thermal stability ofsoluble HRP and immobilized HRP. Each point represents the average of two experiments.
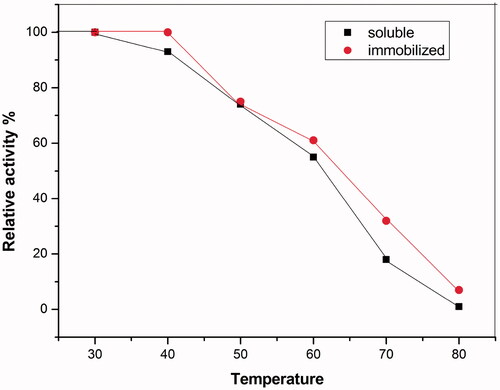
Figure 9. Lineweaver-Burk plots relating soluble HRP and immobilized HRP reaction velocity to guaiacol (a) and H2O2 (b) concentrations. Each point represents the average of two experiments.
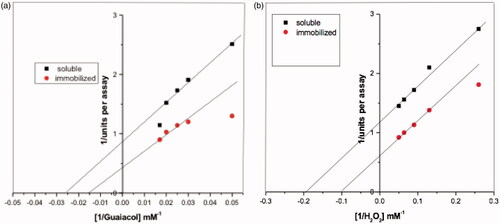
Table 2. The substrate specificity of soluble HRP and immobilized HRP.
Table 3. The effect of 5 mM metal ions on the activity of soluble HRP and immobilized HRP.
Table 4. The effect of chemical compounds on soluble HRP and immobilized HRP.
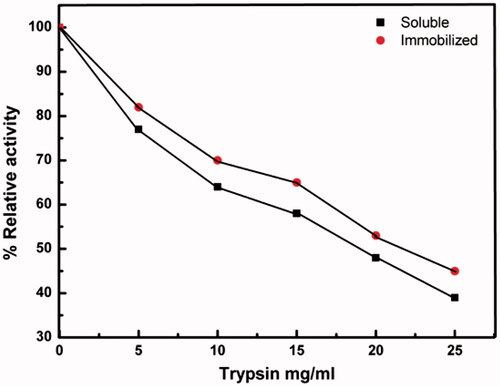
Figure 10. The effect of trypsin concentration on the activity of soluble HRP and immobilized HRP. Each point represents the average of two experiments.