Figures & data
Table 1. Associations between EYA2 expression and clinicopathological characteristics.
Figure 1. EYA2 expression in OS tissue and cell lines. (A) qPCR analysis examined the expression levels of EYA2 in 48 pair of OS samples and the adjacent noncancerous tissues. (B) The expression levels of EYA2 in OS cell lines (MG-63, U2OS, Saos-2 and HOS) and the normal osteoblast cell line (OB3). Values are expressed as mean ± SD, n = 4; *p < .01.
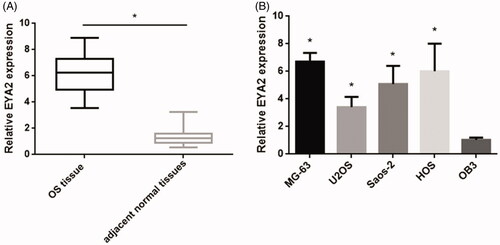
Figure 2. miR-219a-5p regulated EYA2 expression by binding 3′-UTR of EYA2. (A) The bioinformatics analyses predicted that EYA2 has a binding site of miR-219a-5p at its 3′ UTR of EYA2. (B) Dual luciferase reporter assay. Values are expressed as mean ± SD, n = 3; *p < .01 compared with control group. (C) The effects of miR-219a-5p mimics and inhibitors on EYA2 mRNA expression. Values are expressed as mean ± SD, n = 3; *p < .01 compared with mimics NC; **p < .01 compared with inhibitors NC. (D) The effects of miR-219a-5p mimics and inhibitors on EYA2 protein expression. Values are expressed as mean ± SD, n = 3; *p < .01 compared with mimics NC; **p < .01 compared with inhibitors NC.
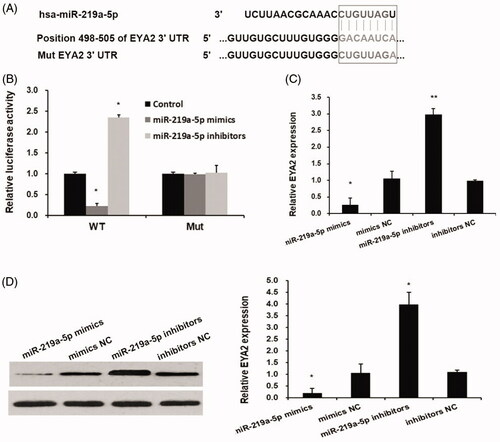
Figure 3. miR-219a-5p expression in OS tissue and cell lines. (A) qPCR analysis examined the expression levels of EYA2 in 48 pair of OS samples and the adjacent noncancerous tissues. (B) The expression levels of miR-219a-5p in OS cell lines (MG-63, U2OS, Saos-2 and HOS) and the normal osteoblast cell line (OB3). Values are expressed as mean ± SD, n = 4; *p < .01.
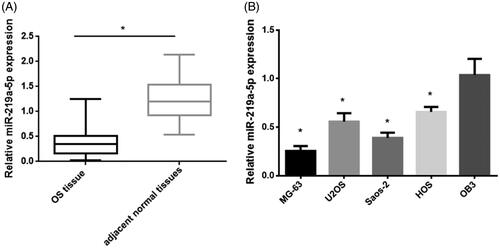
Figure 4. Overexpressed miR-219a-5p repressed OS cell invasion and migration via suppressing EYA2 expression. (A) Effects of miR-219a-5p mimics and EYA2 plasma on EYA2 mRNA expression. (B) Effects of miR-219a-5p mimics and EYA2 plasma on EYA2 protein expression. (C) Effects of miR-219a-5p mimics and EYA2 plasma on OS cell invasion. (D) Effects of miR-219a-5p mimics and EYA2 plasma on OS cell migration. Values are expressed as mean ± SD, n = 4; *p < .01 vs. mimics NC group.
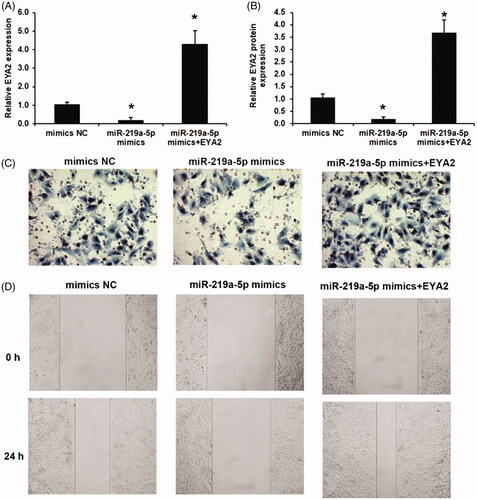
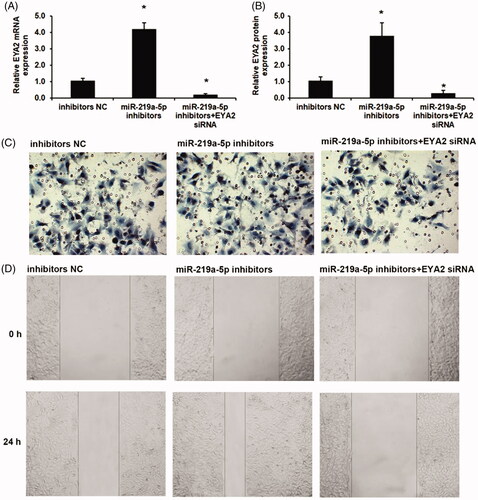
Figure 5. Silenced miR-219a-5p induced OS cell invasion and migration via EYA2 augmentation. (A) Effects of miR-219a-5p inhibitors and EYA2 siRNA on EYA2 mRNA expression. (B) Effects of miR-219a-5p inhibitors and EYA2 siRNA on EYA2 protein expression. (C) Effects of miR-219a-5p inhibitors and EYA2 siRNA on OS cell invasion. (D) Effects of miR-219a-5p inhibitors and EYA2 siRNA on OS cell migration. Values are expressed as mean ± SD, n = 4; *p < .01 vs. mimics NC group.