
Figures & data
Figure 1. Schematic representation of ephrin type-A receptor 2 (EphA2) expression dependent uptake of YSA functionalized nanoparticles. Bleomycin increases the expression of EphA2 surface receptors, which may increase the localization and/or uptake of YSA functionalized nanoparticles. Increased vascular permeability and increased epithelial cell expression of EphA2 in bleomycin injured lungs was previously reported by Carpenter et al. [Citation9].
![Figure 1. Schematic representation of ephrin type-A receptor 2 (EphA2) expression dependent uptake of YSA functionalized nanoparticles. Bleomycin increases the expression of EphA2 surface receptors, which may increase the localization and/or uptake of YSA functionalized nanoparticles. Increased vascular permeability and increased epithelial cell expression of EphA2 in bleomycin injured lungs was previously reported by Carpenter et al. [Citation9].](/cms/asset/fe3d8be4-5cf1-4112-b5e5-bc6d9908ad69/ianb_a_1528984_f0001_c.jpg)
Table 1. Size and zeta-potential of nanoparticles.
Figure 2. Dose- and time-dependent uptake of nanoparticles in human umbilical vein endothelial cells (HUVEC) cells. Cell imaging based quantification of Nile red dye in HUVEC cells at 1, 3 and 6 h following exposure of 0.1 or 0.5 mg/ml nanoparticles with and without YSA-functionalization. Fluorescence intensity is normalized to protein concentration. Data represents mean ± SD for n = 3. *p < .001 compared to the uptake of 0.5 mg/ml PLGA-NR-NP at 3 h. PLGA: poly (dl-lactide-co-glycolide).
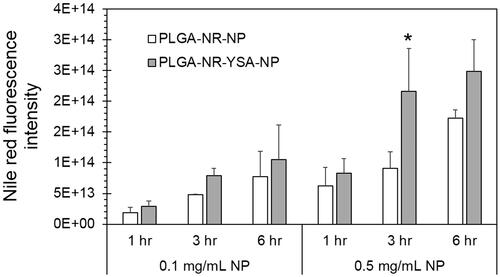
Figure 3. Fluorescence images showing 6-h uptake of nanoparticles by human umbilical vein endothelial cells (HUVEC) cells. High magnification images of HUVEC cells obtained using Operetta high-content imaging system (PerkinElmer, Waltham, MA) at 6 h after treatment with 0.5 mg/ml of nanoparticles with or without YSA-functionalization. Blue stain indicates the cell nucleus, red indicates the Nile red dye, and multicolored lines indicate the cell boundaries.
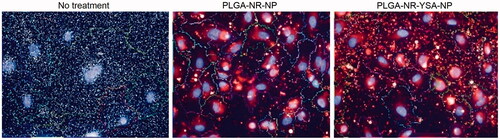
Figure 4. Effect of bleomycin pre-treatment on nanoparticle uptake by human umbilical vein endothelial cells (HUVEC) cells. Spectrofluorometric quantification of 3-h uptake of 0.5 mg/ml PLGA- nanoparticles with and without functionalization by YSA peptide. Data shows Nile red fluorescence in DCM extract of HUVEC cell lysate normalized to protein concentration with or without a 48-h pretreatment with 25 µg/ml bleomycin. Data represents mean ± SD for n = 3. *p < .0001 compared to the corresponding no treatment group. #p < .001 compared to the corresponding PLGA-NR-NP group. DCM: dichloromethane; PLGA: poly (dl-lactide-co-glycolide).
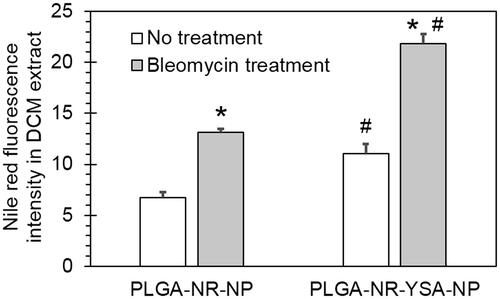
Figure 5. Radiant efficiency, a measure of tissue distribution of nanoparticles, in whole liver and dissected pieces. Whole liver tissue from control animal intravenously injected with 2 mg of non-functionalized DiR dye loaded nanoparticles and three uneven pieces of the same tissue were imaged in the fluorescence mode using Xenogen IVIS 2000 (PerkinElmer). Same area was imaged and counted for each tissue. ICG excitation and emission filters were set to a 0.5 s exposure time. Tissue areas were marked by the contour selection method and the total counts and radiant efficiency were measured. ICG: indocyanine green.
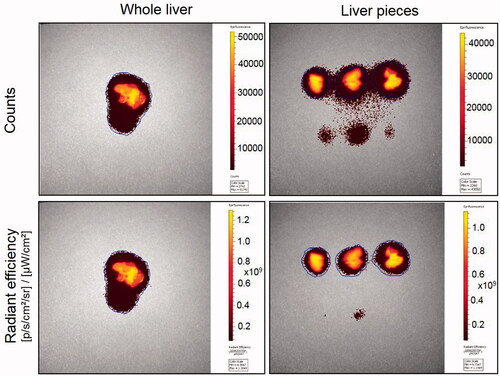
Figure 6. Tissue distribution of functionalized and non-functionalized nanoparticles visualized using IVIS imaging. Representative IVIS images of isolated tissues from mice, 3 days after intravenous injection of nanoparticles with and without YSA-functionalization. Images were obtained in the fluorescence mode using the Xenogen IVIS 2000 (PerkinElmer). The ICG excitation and emission filters were set to a 0.5 s exposure time. Tissue areas were marked by the contour selection method and the radiant efficiency was measured. ICG: indocyanine green.
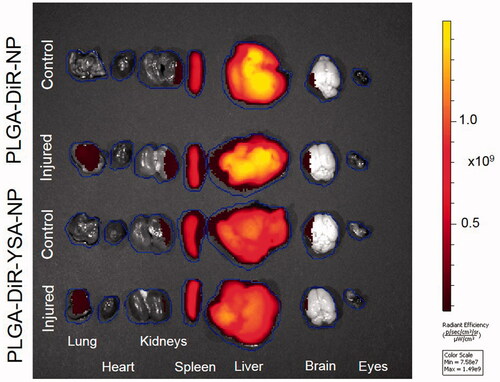
Figure 7. Relative tissue distribution of functionalized and non-functionalized nanoparticles. Mice were dosed intravenously with nanoparticles and sacrificed 3 days after dosing. Tissues were isolated and imaged using Xenogen IVIS 2000 (PerkinElmer). The ICG excitation and emission filters were set to a 0.5 s exposure time. Tissue areas were marked by the contour selection method and the average radiant efficiency was obtained after the subtraction of signal from blank tissues. Data represents mean ± SD for n = 5 or 6. *p < .05 compared to the corresponding control group for the same tissue. ICG: indocyanine green.
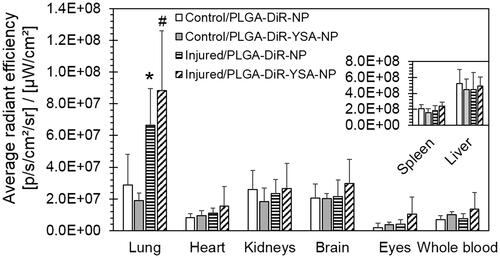
Table 2. Counts, total radiant efficiency and average radiant efficiency of nanoparticle distribution in whole liver versus pieces of the same liver.