Figures & data
Figure 1. Schematic diagram of the oxygen-releasing apparatus.
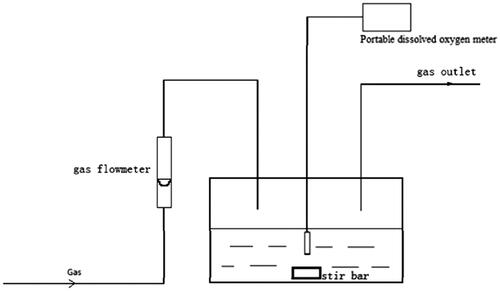
Table 1. General pO2 measurement conditions for Hb- or RBC-releasing oxygen.
Figure 2. The oxygen-releasing curves of Hb and RBCs (pO2 of Hb- or RBC-releasing oxygen was determined at a Hb concentration of 5 g/dL, at 37 °C, pH 7.4, (i) for RBCs in physiological saline; (ii) for Hb in PBS).
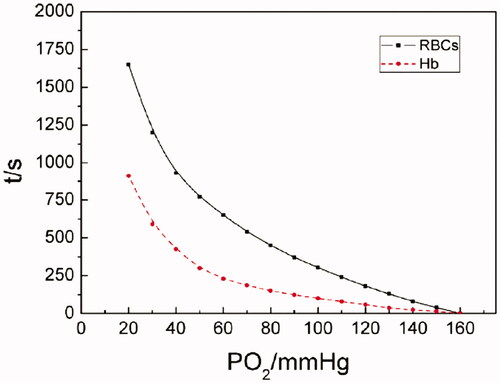
Figure 3. The oxygen-releasing rate curves of Hb and RBCs (PO2 of Hb- or RBC-releasing oxygen was determined at a Hb concentration of 5 g/dL, at 37 °C, pH 7.4, (i) for RBCs in physiological saline; (ii) for Hb in PBS. Dt/dpO2 in the vertical axis referred to the oxygen-releasing rate obtained by taking derivatives of time to pO2).
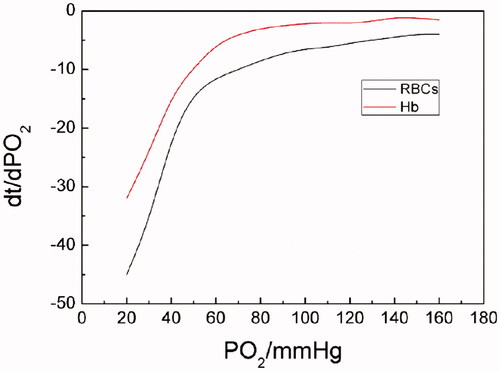
Figure 4. The pO2–time oxygen-releasing curves of Hb in different concentrations (PO2 of Hb releasing oxygen was measured in 0, 3, 6, 9 and 12 mmol/L of PHY solutions, at a Hb concentration of 5 g/dL at 37 °C, pH 7.4).
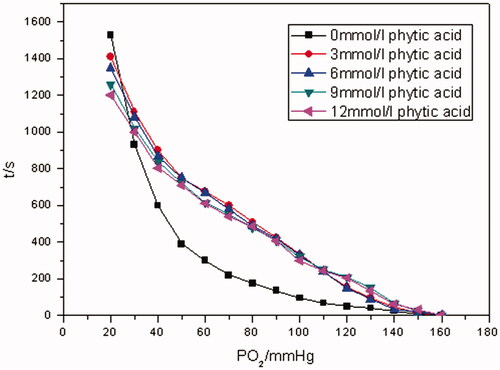
Figure 5. The oxygen-releasing rate curves of Hb in different concentrations of PHY solution (PO2 of Hb-releasing oxygen was measured in 0, 3, 6, 9 and 12 mmol/L of PHY solutions, respectively, at a Hb concentration of 5 g/dL at 37 °C, pH 7.4. Dt/dpO2 in the vertical axis referred to the oxygen-releasing rate obtained by taking derivatives of time to pO2).
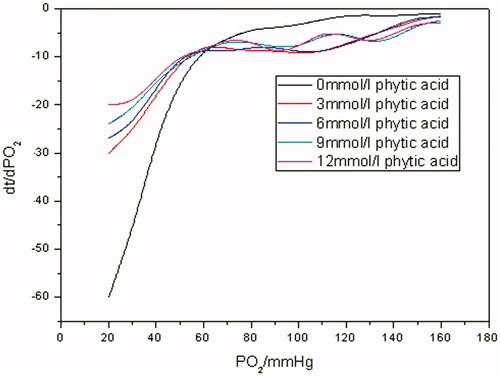
Figure 6. The pO2–time oxygen-releasing curves of RBCs under different osmotic pressures (PO2 of RBC-releasing oxygen was measured in mass fraction 2, 4, 6 and 8% of sodium chloride solution, respectively, at a Hb concentration of 5 g/dL at 37 °C, pH 7.4).
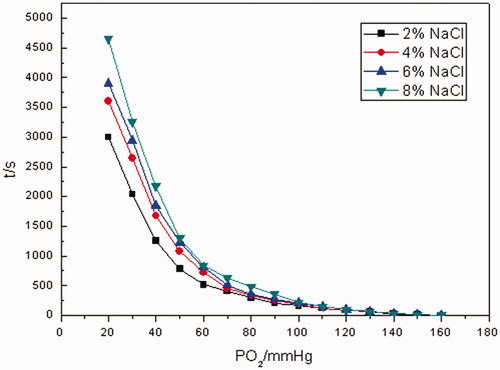
Figure 7. The oxygen-releasing rate curves of RBCs under different osmotic pressures (PO2 of RBC-releasing oxygen was measured in mass fraction 2, 4, 6 and 8% of sodium chloride solution, respectively, at a Hb concentration of 5 g/dL at 37 °C, pH 7.4. Dt/dpO2 in the vertical axis referred to the oxygen-releasing rate obtained by taking derivatives of time to pO2).
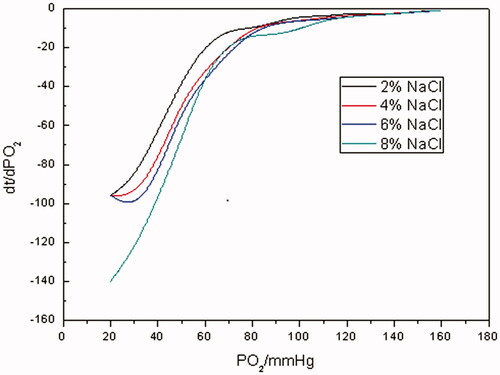
Figure 8. The pO2–time oxygen-releasing curves of Hb with different viscosities (PO2 of Hb-releasing oxygen was measured at different viscosity levels of 200, 500, 800, 1100 mPa•s, respectively, at a Hb concentration of 5 g/dL at 37 °C, pH 7.4).
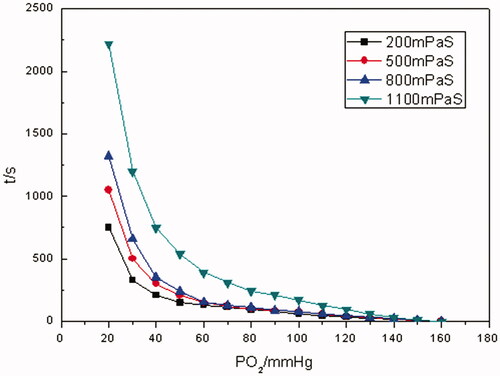
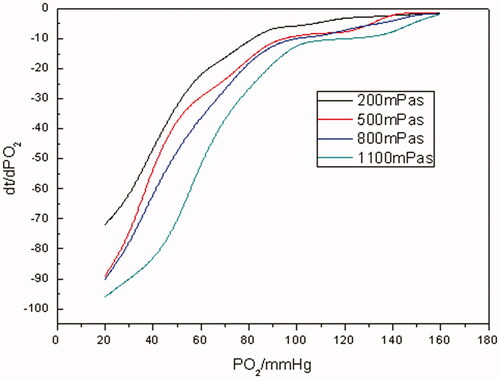
Figure 9. The oxygen-releasing rate curves of Hb with different viscosities (PO2 of Hb-releasing oxygen was measured at different viscosity levels of 200, 500, 800, 1100 mPa•s, respectively, at a Hb concentration of 5 g/dL at 37 °C, pH 7.4. Dt/dpO2 in the vertical axis referred to the oxygen-releasing rate obtained by taking derivatives of time to pO2).
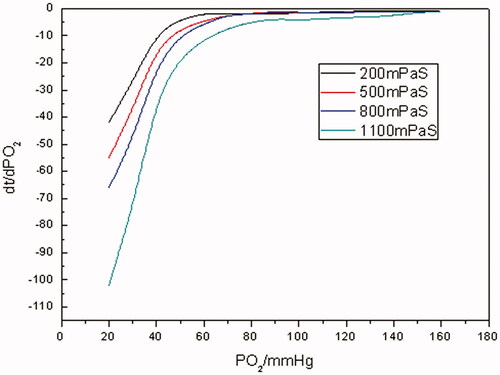
Figure 10. The pO2–time oxygen-releasing curves of RBCs with different viscosities (PO2 of RBC-releasing oxygen was measured at different viscosity levels of 200, 500, 800, 1100 mPa•s, respectively, at a Hb concentration of 5 g/dL at 37 °C, pH 7.4).
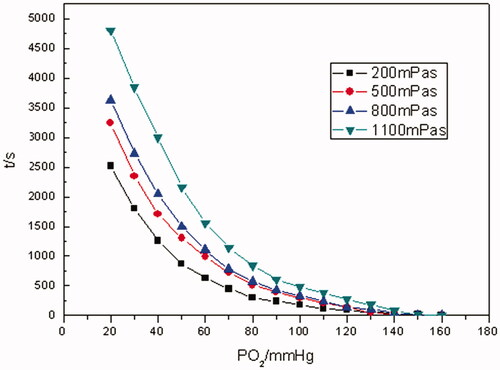
Figure 11. The oxygen-releasing rate curves of RBCs with different viscosities (PO2 of RBC-releasing oxygen was measured at different viscosity levels of 200, 500, 800, 1100 mPa•s, respectively, at a Hb concentration of 5 g/dL at 37 °C, pH 7.4. Dt/dpO2 in the vertical axis referred to the oxygen-releasing rate obtained by taking derivatives of time to pO2).