Figures & data
Figure 1. CAD modeling images of the tracheal scaffold.
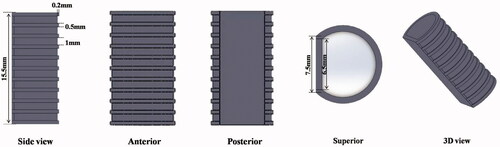
Figure 2. The surgical procedure for the implantation of the tracheal scaffold into the omentum. A. 2-cm-long vertical incision made in the midline of the abdomen. B Omentum is identified though this incision, and gently pulled out from the peritoneal cavity. C, D. 1–3 tracheal scaffolds implanted into the omentum.
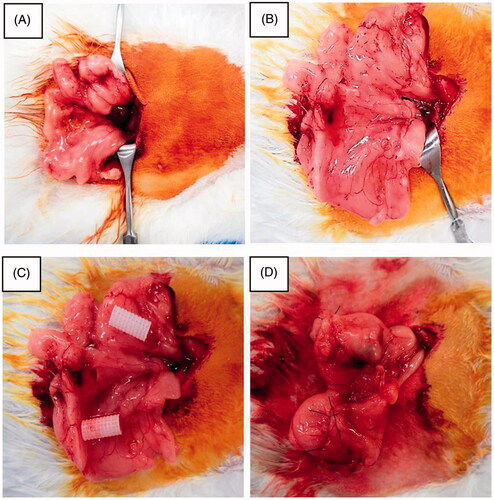
Figure 3. Surgical procedure of tracheal scaffold implantation in rabbit: a 1-cm length circumferential trachea has been removed, and a 3D-printed PCL scaffold, with or without omental culture, implanted into the defect site (arrow-head). PCL: polycaprolactone scaffold group, PCL-OC: PCL scaffold cultured in omentum for 2 weeks before transplantation group.
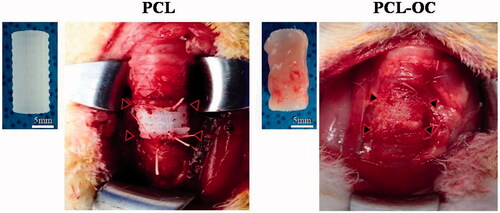
Figure 4. External appearance of the 3D-printed artificial trachea scaffolds. A, B. Superior view. C, D. Anterior view. E, F. Posterior view. A, C, E: x1, B, D, F: x5.
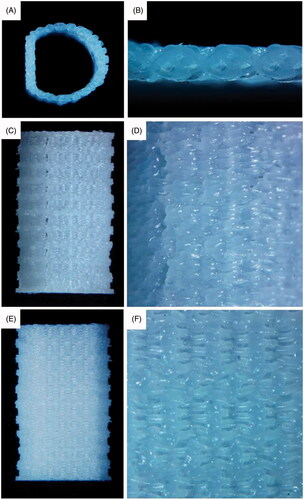
Figure 5. SEM images of the scaffolds. A. Superior view (×100). B. Inferior view (×100). C. Anterior view (×100). D. Inner view (×150).
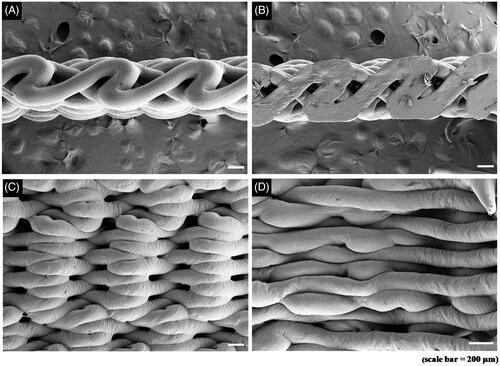
Figure 6. FTIR analysis.
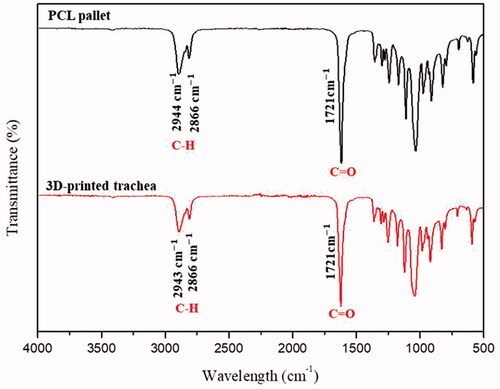
Figure 7. Mechanical properties of 3D-printed PCL tracheal scaffolds. A. Tensile strength. B. 3-point bending strength.
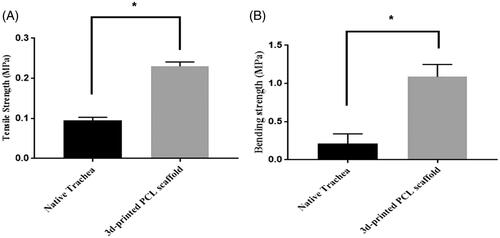
Table 1. A summary of animal experiments.
Figure 8. 3D-printed PCL tracheal scaffolds after 2 weeks of prior omental implantation. A. Anterior view. B. Superior view. C. H&E staining (x100), The asterisk indicates the cell ingrowth into the porous region L: lumen, S: scaffold.
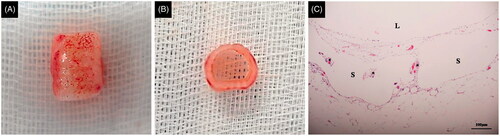
Figure 9. Bronchoscopic images. The asterisk indicates the implanted scaffolds. A–D. PCL-OC group. E–G. PCL group. PCL: polycaprolactone scaffold group, PCL-OC: PCL scaffold cultured in omentum for 2 weeks before transplantation group.
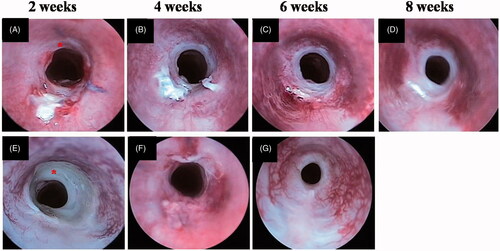
Figure 10. H&E staining. A–H. PCL-OC group. I–N. PCL group. A–D, I–K. ×200. E–H, L–N. ×400. PCL: polycaprolactone scaffold group, PCL-OC: PCL scaffold cultured in omentum for 2 weeks before transplantation group.
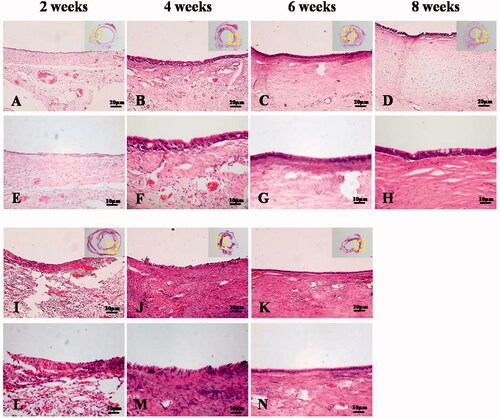
Figure 11. Higher magnification of H&E staining and immunohistochemical staining against cytokerain. A,B. PCL-OC group (8 weeks after transplantation). C,D. PCL group (6 weeks after transplantation). ×1000. The asterisk indicates cilia. The arrow head indicates goblet cell.
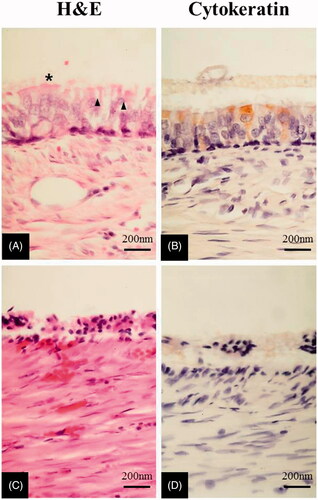
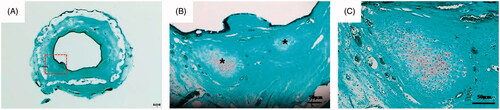
Figure 12. Safranin O staining of omentum-cultured PCL scaffold group at 8 weeks postoperatively. The asterisk indicates neo-cartilage. A. ×6.5, B. ×100, C. ×200.