Figures & data

Figure 1. XRD patterns of (a) uncoated Fe3O4 NPs and (b) CA-MNPs.
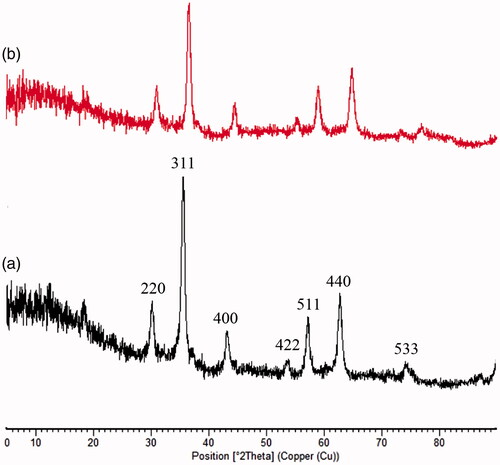
Figure 2. FTIR spectra of (a) uncoated Fe3O4 NPs, (b) citric acid and (c) CA-MNPs.
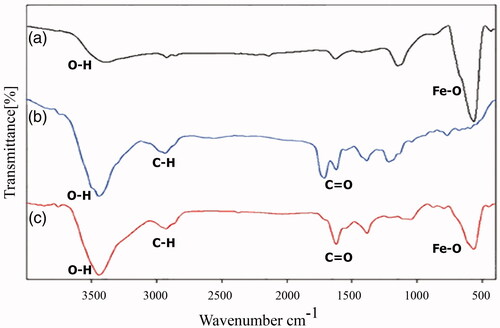
Figure 3. (a) TEM image, (b) FESEM image and (c) hydrodynamic size distribution of CA-MNPs by DLS analysis.
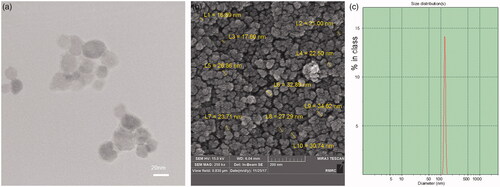
Figure 4. Magnetization curves of (a) uncoated Fe3O4 NPs and (b) CA-MNPs.
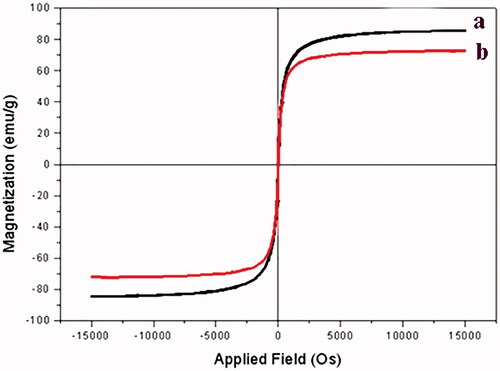
Figure 5. (a) Full scan mass spectrum of DOX and (b) product ion spectrum of the mass-selected [M + H]+ ion of m/z 544.1.
![Figure 5. (a) Full scan mass spectrum of DOX and (b) product ion spectrum of the mass-selected [M + H]+ ion of m/z 544.1.](/cms/asset/20c34675-e09d-4af4-a24f-c5bb6e51629d/ianb_a_1536063_f0005_b.jpg)
Figure 6. (a) Full scan mass spectrum of MEL and (b) product ion spectrum of the mass-selected [M + 5H]5+ ion of m/z 570.2.
![Figure 6. (a) Full scan mass spectrum of MEL and (b) product ion spectrum of the mass-selected [M + 5H]5+ ion of m/z 570.2.](/cms/asset/a4b577a2-f8ad-4385-8748-53f72b910385/ianb_a_1536063_f0006_b.jpg)
Figure 7. Representative SRM chromatograms of DOX and MEL.
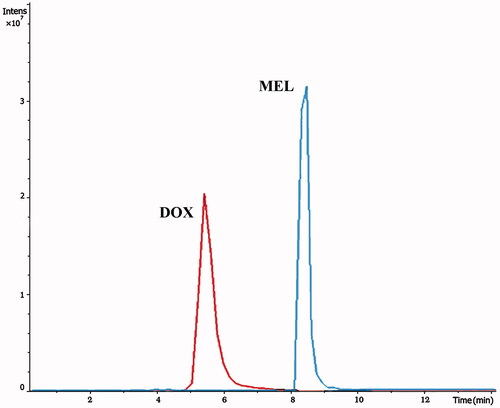
Table 1. Cytotoxicity of different treatment combinations of DOX and MEL against MCF-7 cells after 48 h incubation.
Figure 8. DOX and MEL loading efficiency (binding isotherm of DOX and MEL with CA-MNP).
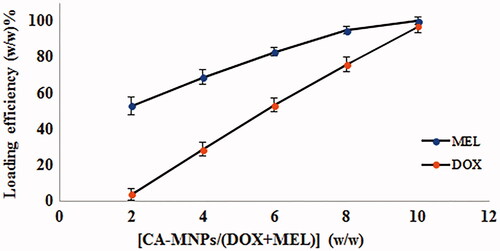
Figure 9. (a) FESEM image and (b) hydrodynamic size distribution of (DOX/MEL)-loaded CA-MNPs by DLS analysis.
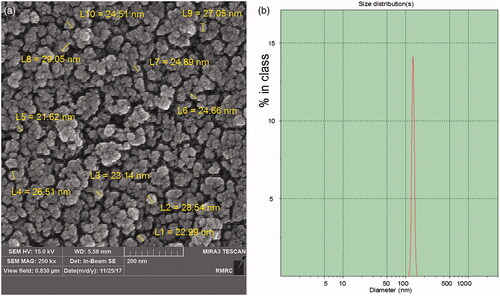
Figure 10. In vitro release profiles of (a) DOX and (b) MEL from (DOX/MEL)-loaded CA-MNPs at different pH values.
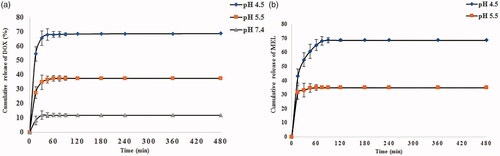
Table 2. Release kinetics data of DOX and MEL from CA-MNPs at different pH values.
Figure 11. Viabilities of MCF-7 cells after 48 h treatment with medium containing different concentrations of CA-MNP.
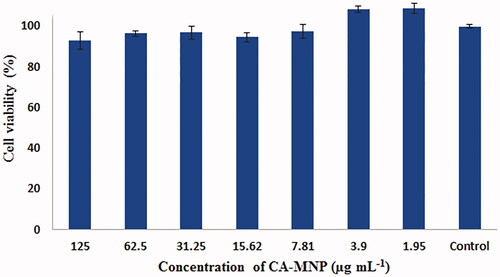
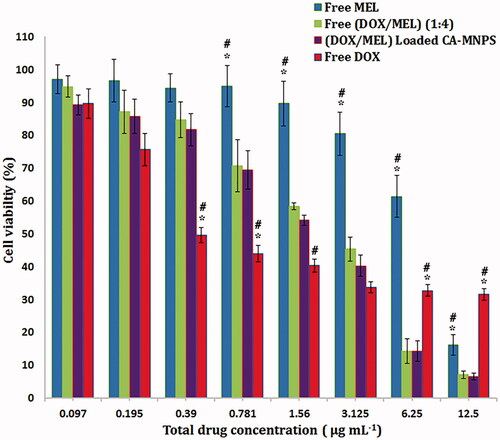
Figure 12. Viabilities of MCF-7 cells after 48 h treatment with medium containing different formulations at various concentrations of DOX and MEL. Statistical significance between groups: free DOX and free MEL vs. (DOX/MEL)-loaded CA-MNPs *p<.05, free DOX and free MEL vs. free (DOX/MEL) (1:4) #p<.05.