Figures & data
Figure 1. Flow diagram of preparation process of mulberry silkworm cocoon (MSC) extract and derived carbon dots (MSC-CDs).
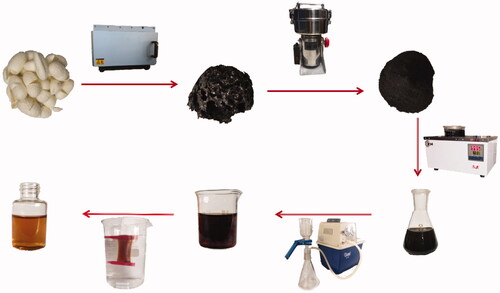
Figure 2. Characteristics of mulberry silkworm cocoon-derived carbon dots (MSC-CDs). (A) Transmission electron microscopy (TEM) image. (B) Histogram depicting particle size distribution. (C) High-resolution TEM (HRTEM) image.
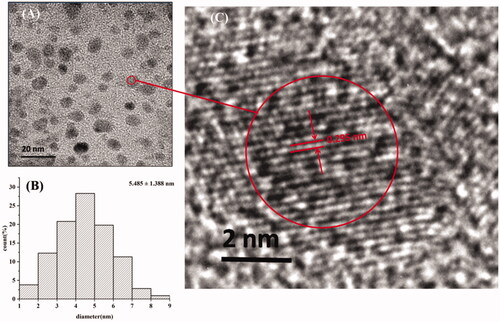
Figure 3. Characterisation of mulberry silkworm cocoon-derived carbon dots (MSC-CDs). (A) Ultraviolet-visible (UV–Vis) and (B) fluorescent spectra. EM, emission; EX, excitation. (C) X-ray diffraction (XRD) pattern. (D) Fourier transform infra-red (FTIR) spectrum.
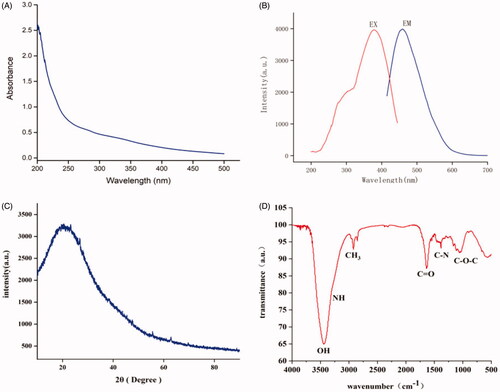
Figure 4. X-ray photoelectron spectroscopy (XPS) spectra. (A) XPS survey spectrum. (B) C 1 s, (C) O 1 s, and (D) N 1 s XPS spectra.
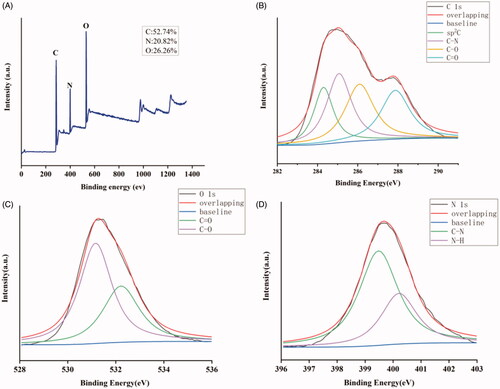
Figure 5. Viability of RAW 264.7 cells after incubation with various concentrations of mulberry silkworm cocoon-derived carbon dots (MSC-CDs) for 24 h.
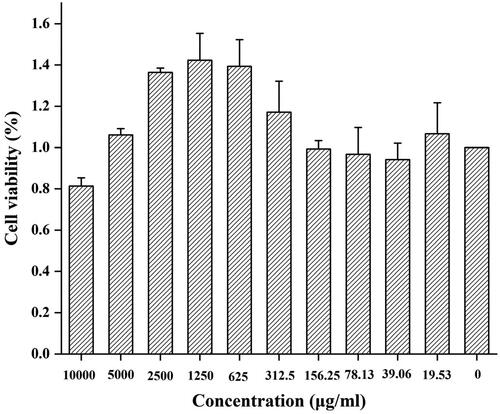
Figure 6. (A) 1. Flow diagram of vascular permeability induced by acetic acid and representative images of lavage fluid from NS, Acetic and H group. (A) 2. Effect of mulberry silkworm cocoon-derived carbon dots (MSC-CDs) on acetic acid-induced vascular permeability in mice. MSC-CDs decreased plasma extravasation induced by acetic acid. ***p < .001, **p < .01, and *p < .05 compared with the acetic group; ###p < .001, compared with the NS group (all n = 6). (B) 1. Representative images of ears from normal, DMB, and H groups. (B) 2. Effect of MSC-CDs on DMB-induced ear oedema in mice. MSC-CDs decreased the percentage inflammation of mouse ears. **p < .01 compared with DMB group (n = 6). DMB, dimethylbenzene; H, M, L, high-, medium-, and low-dose MSC-CDs.
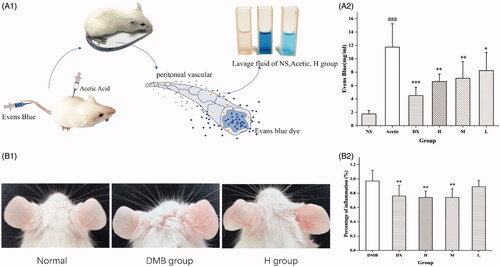
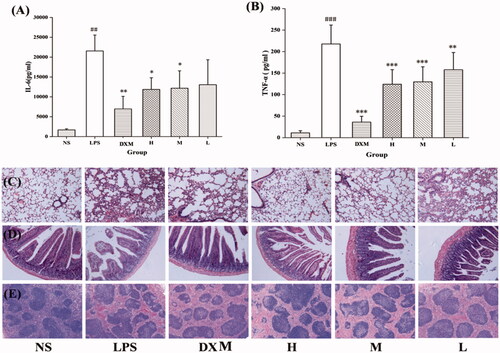
Figure 7. Effects of mulberry silkworm cocoon-derived carbon dots (MSC-CDs) on cytokine levels and pathological features in mice. Effect on (A) IL-6 and (B) TNF-α. Effect on histopathological damage of (C) lungs, (D) small intestine, (E) spleen. Groups (n = 6 each): normal control (NS), model (LPS), DX (0.67 KU/kg), and different doses of MSC-CDs (1.4, 0.7, and 0.35 mg/kg). *p < .05; **p < .01, and ***p < .001 compared with model group; ##p < .01 and ###p < .001, compared with NS group.