Figures & data
Figure 1. Aloperine ameliorated ox-LDL-induced oxidative stress in HUVECs. Cells were cultured with ox-LDL (100 µg/mL) with or without aloperine (50,100 μM) for 24 h. (A). Intracellular ROS. Scale bar, 100 μm; (B). Expression of anti-oxidative factors NQO-1 and GCLC (*, p < .01 vs. vehicle group; #, p < .01 vs. ox-LDL treatment group; $, p < .01 vs. ox-LDL + 50 μM aloperine group).
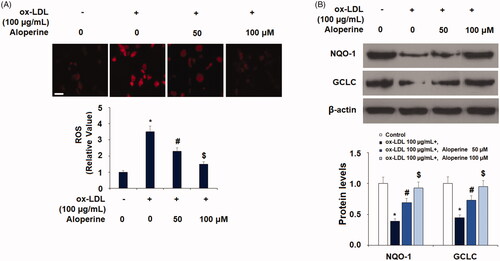
Figure 2. Aloperine reduced ox-LDL-induced expression and secretions of pro-inflammatory cytokines in HUVECs. Cells were cultured with ox-LDL (100 µg/mL) with or without aloperine (50,100 μM) for 24 h. (A). mRNA of IL-6 and MCP-1; (B). Protein of IL-6 and MCP-1 (*, p < .01 vs. vehicle group; #, p < .01 vs. ox-LDL treatment group; $, p < .01 vs. ox-LDL + 50 μM aloperine group).
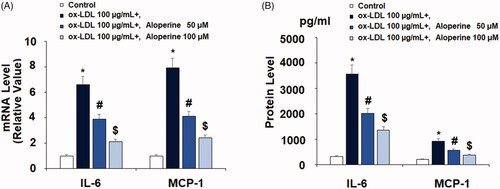
Figure 3. Aloperine prevented ox-LDL-induced reduction of cell viability and lactate dehydrogenase (LDH) release. Cells were cultured with ox-LDL (100 µg/mL) with or without aloperine (50,100 μM) for 24 h. (A). Cell viability; (B). LDH release (*, p < .01 vs. vehicle group; #, p < .01 vs. ox-LDL treatment group; $, p < .01 vs. ox-LDL + 50 μM aloperine group).
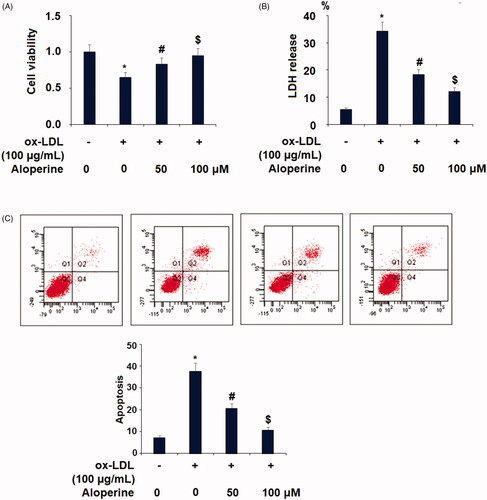
Figure 4. Aloperine inhibited ox-LDL-induced attachment of human U937 monocytes to HUVECs and the expression of VCAM-1 and E-selectin. Cells were cultured with ox-LDL (100 µg/mL) with or without aloperine (50,100 μM) for 24 h. (A). Attachment of U937 monocytes to HUVECs was measured. Scale bar, 100 μm; (B). mRNA of VCAM-1 and E-selectin; (C). Protein of VCAM-1 and E-selectin (*, p < .01 vs. vehicle group; #, p < .01 vs. ox-LDL treatment group; $, p < .01 vs. ox-LDL + 50 μM aloperine group).
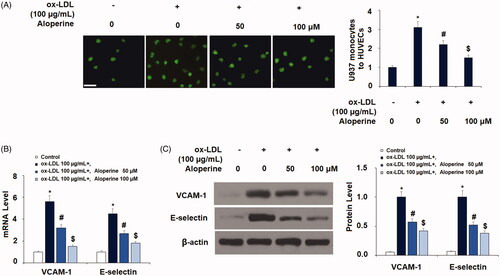
Figure 5. Aloperine reduced ox-LDL-induced expression of LOX-1 in HUVECs. Cells were cultured with ox-LDL (100 µg/mL) with or without aloperine (50,100 μM) for 6 h. (A). mRNA of LOX-1; (B). Protein of LOX-1 (*, p < .01 vs. vehicle group; #, p < .01 vs. ox-LDL treatment group; $, p < .01 vs. ox-LDL + 50 μM aloperine group).
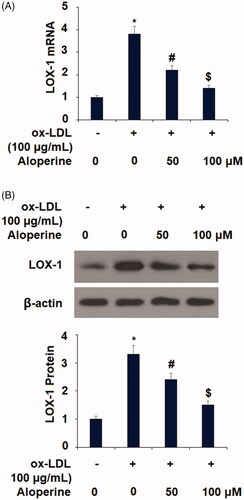
Figure 6. Aloperine restored ox-LDL-induced reduction of KLF2 in HUVECs. Cells were cultured with ox-LDL (100 µg/mL) with or without aloperine (50,100 μM) for 24 h. (A). mRNA of KLF2; (B). Protein of KLF2 (*, p < .01 vs. vehicle group; #, p < .01 vs. ox-LDL treatment group; $, p < .01 vs. ox-LDL + 50 μM aloperine group).
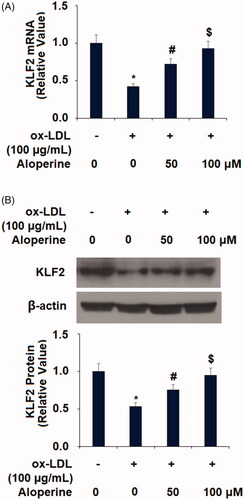
Figure 7. Aloperine restored ox-LDL-induced reduced eNOS expression in HUVECs. Cells were cultured with ox-LDL (100 µg/mL) with or without aloperine (50,100 μM) for 24 h. (A). mRNA of eNOS; (B). Protein of eNOS (*, p < .01 vs. vehicle group; #, p < .01 vs. ox-LDL treatment group; $, p < .01 vs. ox-LDL + 50 μM aloperine group).
Figure 8. Aloperine mitigated ox-LDL-induced activation of p53 in HUVECs. Cells were cultured with ox-LDL (100 µg/mL) with or without aloperine (50,100 μM) for 2 h. Phosphorylated and total levels of p53 were assayed (*, p < .01 vs. vehicle group; #, p < .01 vs. ox-LDL treatment group; $, p < .01 vs. ox-LDL + 50 μM aloperine group).
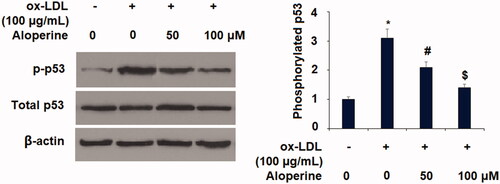
Figure 9. Blockage of LOX-1 abolished the ox-LDL-induced activation of p53 and reduction of KLF2 in HUVECs. Cells were treated with ox-LDL (100 µg/mL) with or without LOX-1 neutralizing antibody (LOX-1 Ab) and LOX-1 inhibitor Poly(I) for 24 h. The levels of p-p53, total p53, and KLF2 were measured (*, p < .01 vs. vehicle group; #, p < .01 vs. ox-LDL treatment group).
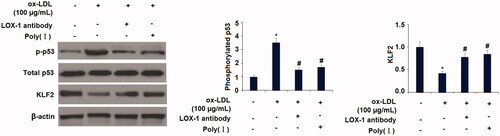
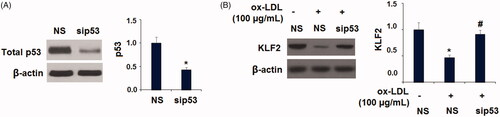
Figure 10. Silencing of p53 abolished the ox-LDL-induced reduction of KLF2 in HUVECs. Cells were transfected with p53 siRNA for 24 h, followed by stimulation with ox-LDL (100 µg/mL) for another 24 h; (A). The successful knockdown of p53; (B). Expression of KLF2 (*, p < .01 vs. vehicle group; #, p < .01 vs. ox-LDL treatment group).