Figures & data
Figure 1. The schematic diagram of the mechanism of the magnetic targeting pro-coagulant protein.
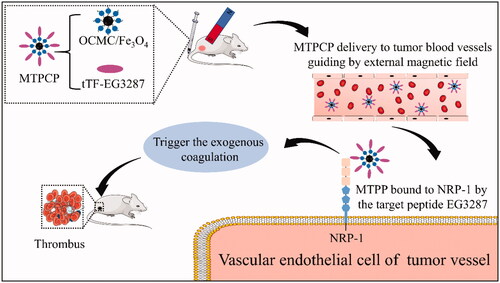
Figure 2. The process of synthesis of magnetic targeting pro-coagulant protein.
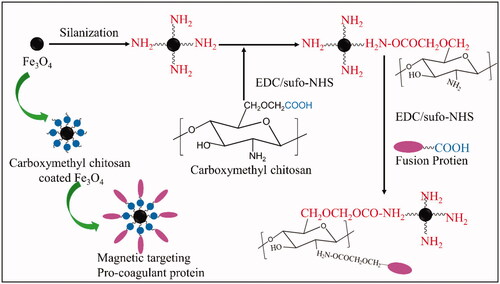
Table 1. Treatment strategy and grouping of experiments in mice.
Figure 3. Identification of the fusion protein tTF-EG3287. (A) Analysis of different induction time (0–6 h) of the fusion protein tTF-EG3287 by Coomassie-stained SDS-PAGE. (B) Purification of the fusion protein. The proteins were purified from E. coli by use of nickel column chromatography. Shown is a crude lysate (Lane1), column flow-through (Lane2), wash (Lane3,4), and elution(Lane5) for the fusion protein tTF-EG3287. (C) Western blot analysis of the purified fusion protein samples, using an anti-His-Tag antibody. (D) The standard curve of the BCA assay.
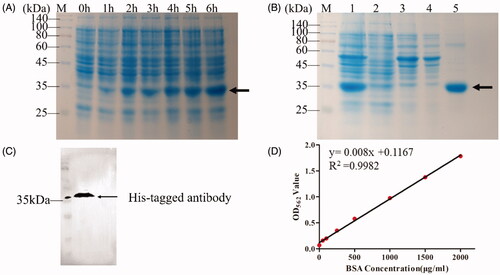
Figure 4. Characterisation of Fe3O4, OCMC/Fe3O4 and tTF-EG3287@OCMC/Fe3O4. (A) Transmission electron microscope image of Fe3O4(a), OCMC/Fe3O4(b) and tTF-EG3287@OCMC/Fe3O4(c), scale bar = 50nm; (B)The particle size analysis of Fe3O4(a), OCMC/Fe3O4 (b) and tTF-EG3287@OCMC/Fe3O4 (c) calculated by Malvern laser diffraction analyser; (C) X-ray diffraction (XRD) patterns of Fe3O4(a), OCMC/Fe3O4(b) and tTF-EG3287@OCMC/Fe3O4(c); (D) Fourier transform infra-red (FTIR) spectra of Fe3O4(a), OCMC(b) and OCMC/Fe3O4(c); (E) Magnetisation curve for the uncoated at Fe3O4(a), OCMC/Fe3O4(b) and tTF-EG3287@OCMC/Fe3O4(c) at 150K. (F) Stability analysis of Fe3O4(a), OCMC/Fe3O4(b) and tTF-EG3287@OCMC/Fe3O4(c) after standing for 24 h.
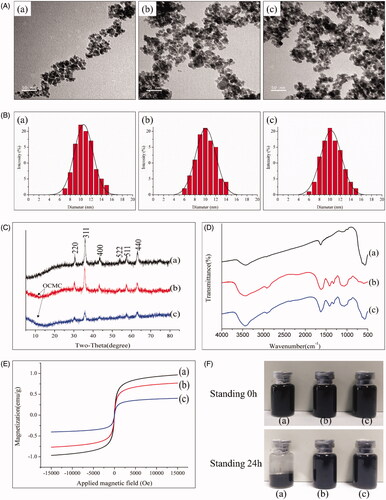
Figure 5. Biological functions of the magnetic targeting pro-coagulant protein. (A) Spectrozyme FXa Assay of the tTF, tTF-EG3287 and tTF-EG3287@OCMC/Fe3O4. PBS and OCMC/Fe3O4 were used as negative control. Data represent the means ± SE of five independent experiments. Confocal microscopy (B) and flow cytometry (C) were used to evaluate the NRP-1 binding ability of the magnetic procoagulant protein on HUVEC cell. (D) Cytotoxicity on HepG2 and HUVEC cells after treated with tTF-EG3287@OCMC/Fe3O4 for 24 h. The values presented are the means ± SE of three independent experiments.
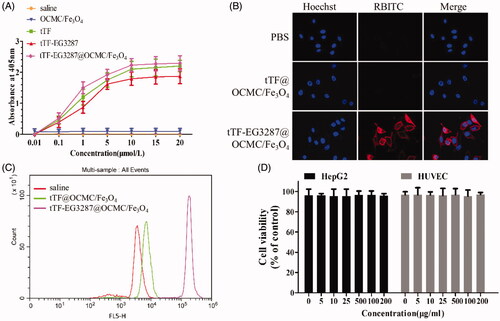
Figure 6. Magnetic targeting ability of the magnetic targeting pro-coagulant protein detected by in vivo imaging system. (A) Delegate in vivo fluorescence images at various times after tail vein infusion with saline(a), OCMC/Fe3O4(b) and Cy5.5-tTF-EG3287(c) and Cy5.5-tTF-EG3287@OCMC/Fe3O4(d). As the reference scale on the right, different colours indicates different fluorescence intensities. Blue indicates strong fluorescence signal and red colour indicates a weak signal. (B) Cy5.5 fluorescence intensity in tumour tissues collected at 72 h following injection. Results were presented as means ± SE for a group of 3 mice.
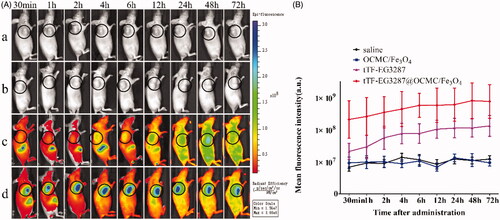
Figure 7. Effect of the magnetic procoagulant protein on growth of tumour in mice models. (A) Tumour volume of HepG2 tumour-bearing mice of each groups. Data are presented as means ± SE of two independent experiments. Statistical comparisons were done for each time point. Asterisks, statistical significance between tTF-EG3287@OCMC/Fe3O4 and controls (saline, OCMC/Fe3O4 and tTF-EG3287). Arrows, time points of injection. (B) Average body weight of mice in each group, data represent the means ± SE of two independent experiments. (C) Average tumour weights of HepG2 tumour-bearing mice of each groups after treatment, data are presented as means ± SE of two independent experiments. (D) Representative pictures of the HepG2 tumour bearing mice at the end of treatment (Day 7) by saline (a), OCMC/Fe3O4 (b), tTF-EG3287 (c) and tTF-EG3287@OCMC/Fe3O4 (d).
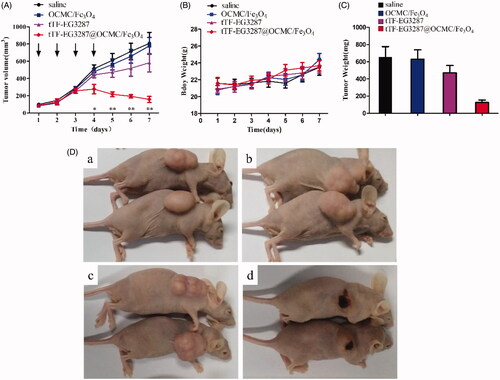
Table 2. Antitumor activity of the magnetic procoagulant protein in mice.
Figure 8. Histology studies of the treatment effect of the magnetic procoagulant protein in subcutaneous transplantation tumour models. (A ∼ C) Representative picture of the cancer tissue after treatment of controls groups (saline (A), OCMC/Fe3O4 (B) and tTF-EG3287 (C)) stained with haematoxylin and eosin. Obvious thrombus (D ∼ F) and necrotic area (G ∼ I) were found in the blood vessels of hepatic carcinoma after treated by the MTPCP tTF-EG3287@OCMC/Fe3O4 for 4 consecutive days.
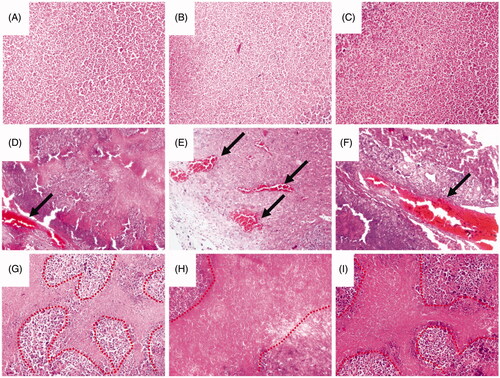
Figure 9. Thrombotic risk assessment in the normal organs of the treated mice. Histological analysis of various normal organs of tumour-bearing mice treated with the MTPCP. Sections of heart (A), liver (B), spleen (C), lung (D), kidney (E) and brain (F) were stained with haematoxylin and eosin (H&E).
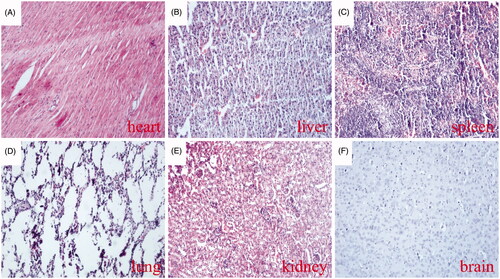
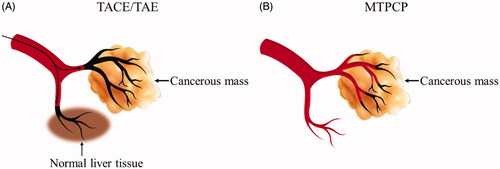
Figure 10. Schematic diagrams of TACE/TAE (A) and the magnetic targeting pro-coagulant protein (B).