Figures & data
Figure 1. CYLD knockout suppressed the progression of lung adenocarcinoma. (A) The tumour growth in WT mice and CYLD−/− mice. (B) The survival rate of WT mice and CYLD−/− mice with tumour volume reached ∼3 cm3. (C) The CD4+ T cell and DCs infiltration in lung adenocarcinoma. The secretion of IL-17, (D) IL-6, (E) IL-1β, (F) IL-23 and (G) in lung adenocarcinoma. *p < .01 vs WT mice.
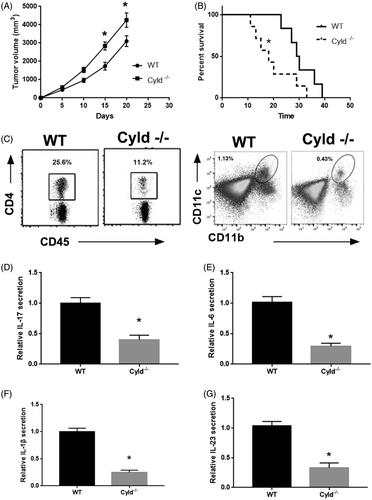
Figure 2. Knockout CYLD in DCs suppressed the progression of lung adenocarcinoma. (A) The tumour growth in WT mice and DC(CYLD-KO) mice. (B) The survival with tumour volume reached ∼3 cm3 in WT mice and DC(CYLD-KO) mice. (C) The CD4+ T cell and DCs infiltration in lung adenocarcinoma in WT mice and DC (CYLD-KO) mice. The secretion of IL-17, (D) IL-6, (E) IL-1β, (F) IL-23 and (G) in lung adenocarcinoma in WT mice and DC(CYLD-KO) mice. *p < .01 vs WT mice.
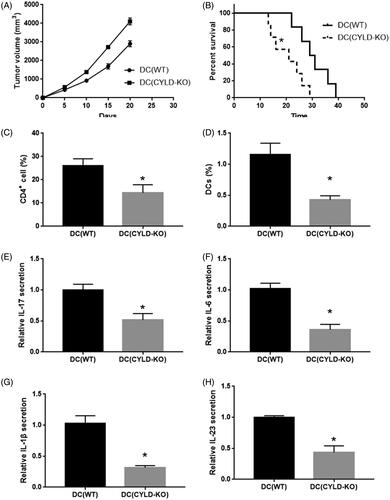
Figure 3. Reduced NF-κB signalling in CYLD knockout DCs. (A) WB revealed the p-p65 and p65 expression in WT DCs and CYLD knockout DCs. (B) The nuclear translocation of p-p65 in WT DCs and CYLD knockout DCs. (C) PDTC reduced the expression of IL-6, IL-1β and IL-23 in DCs. *p < .05.
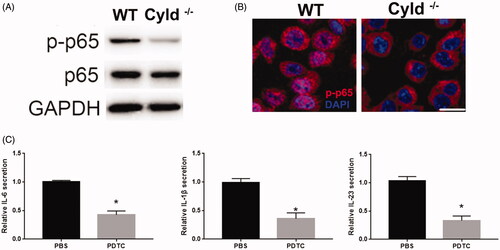
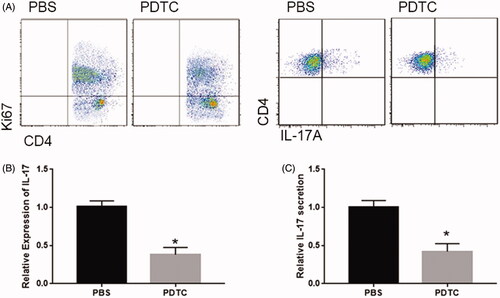
Figure 4. NF-κB pathway involved the DCs-induced proliferation and function of CD4+ T Cells. (A) PDTC repressed DCs-induced proliferation and differentiation of CD4+ T cells. PDTC repressed the expression, (B) secretion and (C) of IL-17 in T cell co-cultured with DCs. *p < .05 vs PBS group.